The Federal Open Market Committee (FOMC) announced a 50-basis point cut to the federal fund rates. The target range is now between 4.75%-5%.
Unemployment fell to 4.2%, with the labor force participation keeping strong at 62.7%.
New Orders fell in August dropping 2.8 points making the mark 44.6. This drop is the 5th straight month of contraction, and the lowest levels since May of 2023.
Inventory levels remain low.
Industrial production jumped a little in August, increasing 0.8%.
Mortgage rates on a 30-year fixed loan fell below 7%.
Current rate is now 6.2%, almost a full percentage lower than a year ago.
LTL
LTL carriers continue to see a rise in RFPs.
Saia looks to open 3 new terminals in September
Bismarck and Fargo, ND & Sidney, MT
Estimated earnings for LTL carriers fell below what was anticipated in August.
Tonnage decline causing the majority of the issues for the LTL carriers.
National Motor Freight Traffic Association (NMFTA) will be rolling out density-based classification for 3PLs.
Shippers will soon have to know the weight and dimensions of all handling units.
Proposed change will be issued in January of 2025 potentially to begin in May of 2025.
Key Information for LTL shippers when requesting pricing:
Dimensions, Class, NMFC numbers, & weights are critical to getting the correct price on the front end of your shipment.
Truckload
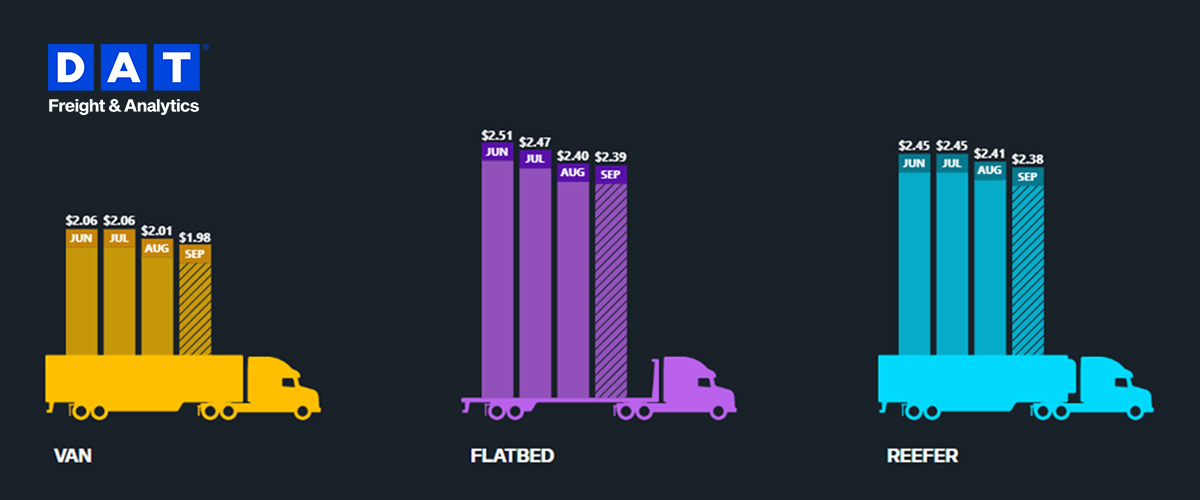
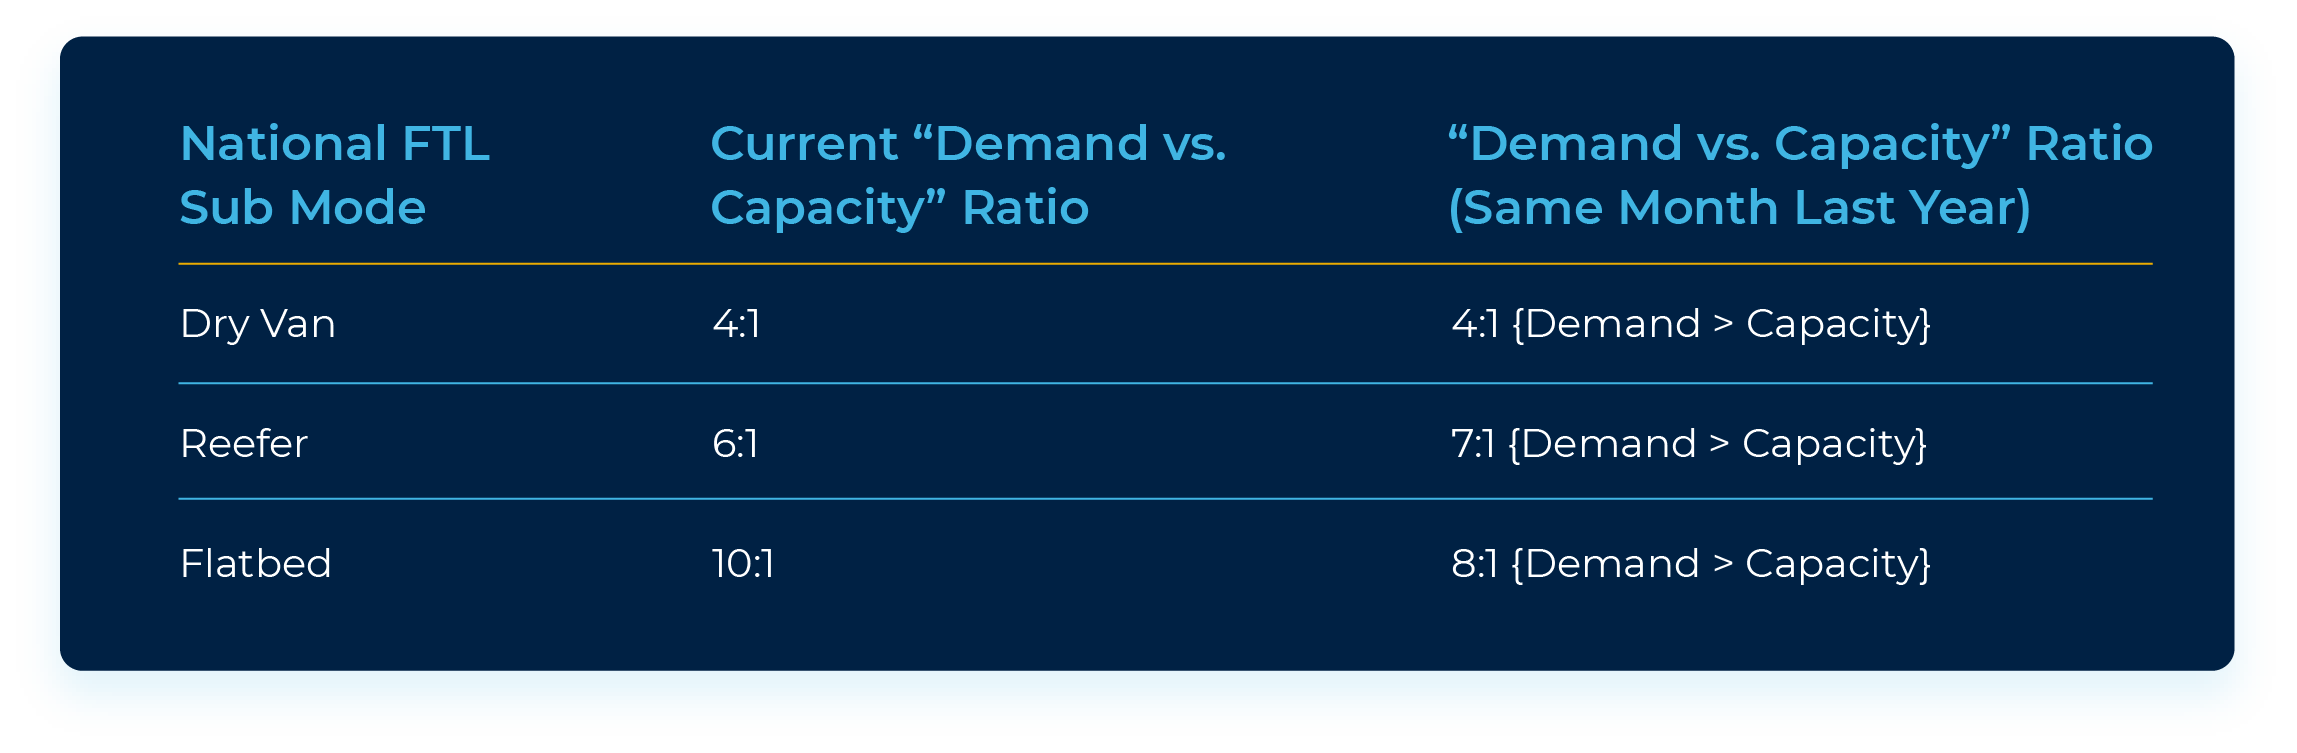
Van spot rates were down 3.5% vs. this same time last year and down 2.6% vs. last month. Capacity improved from the same time last year by 8.4% and improved by 13.2% vs. last Month. September Van contracted pricing is up $.42 per mile over spot market.
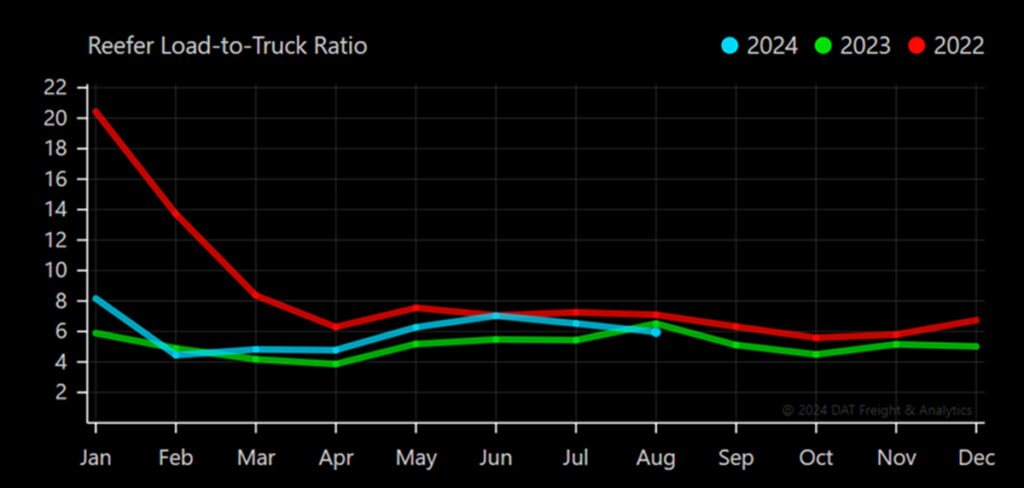
Reefer spot rates decreased slightly by 1.5% vs. this same time last year and decreased 3.7% vs. last month. Capacity improved from last year this same time by 8.3% and improved by 8.3% vs. last month. September Reefer contracted pricing is tracking up $.36 per mile over spot market.
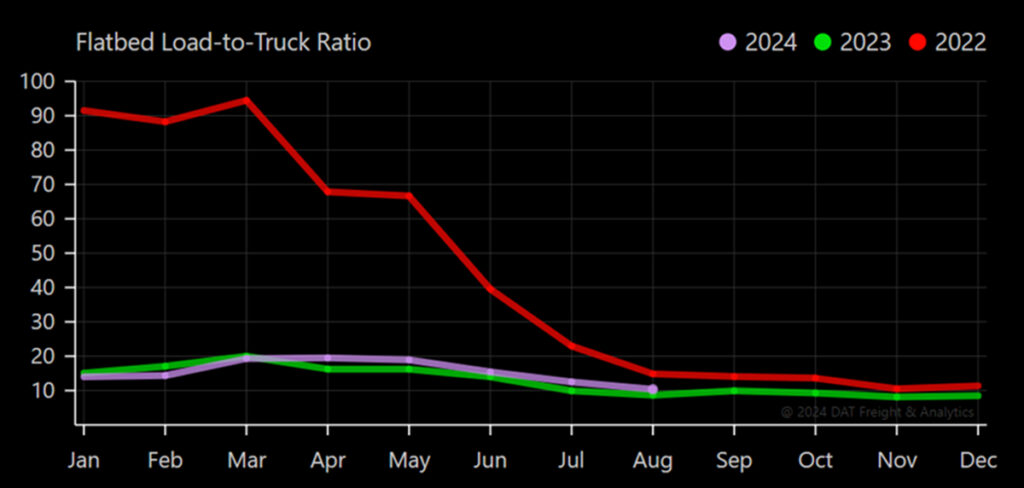
Flatbed spot rates are down 4.2% vs. this same time last year, and down 2.8% vs. last month. Capacity decreased by 19.1% vs. this same time last year but improved by 17.0% over last month. September Flatbed contracted pricing is tracking up $0.64 per mile over spot market.
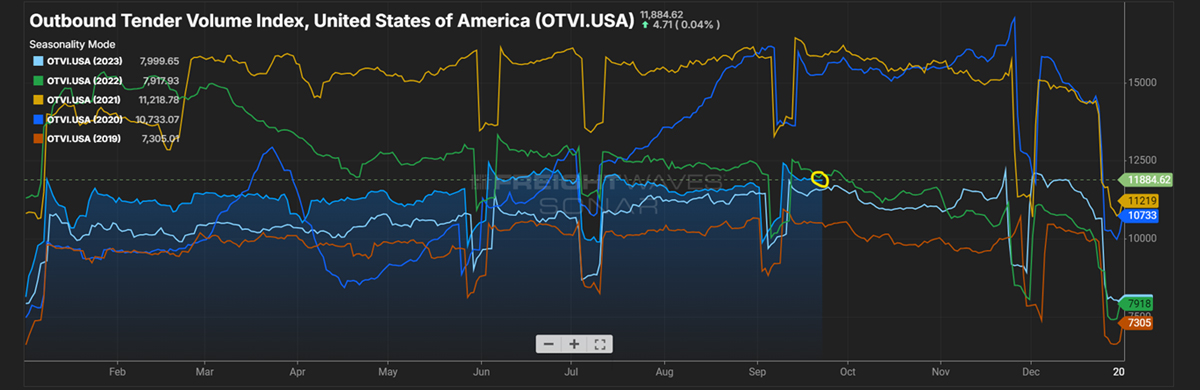
Outbound Tender Volume – All Modes
Demand still showing up vs last year. It’s important to keep a close eye on the outbound volume as we get closer to Q4.
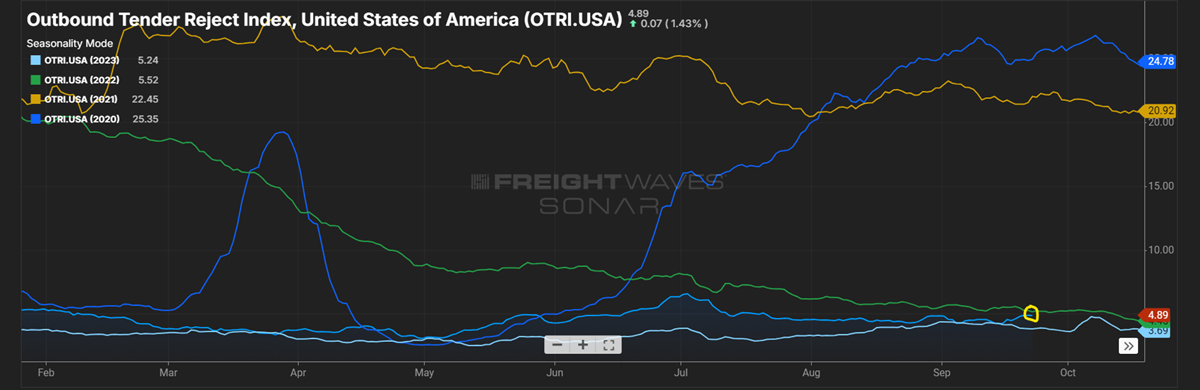
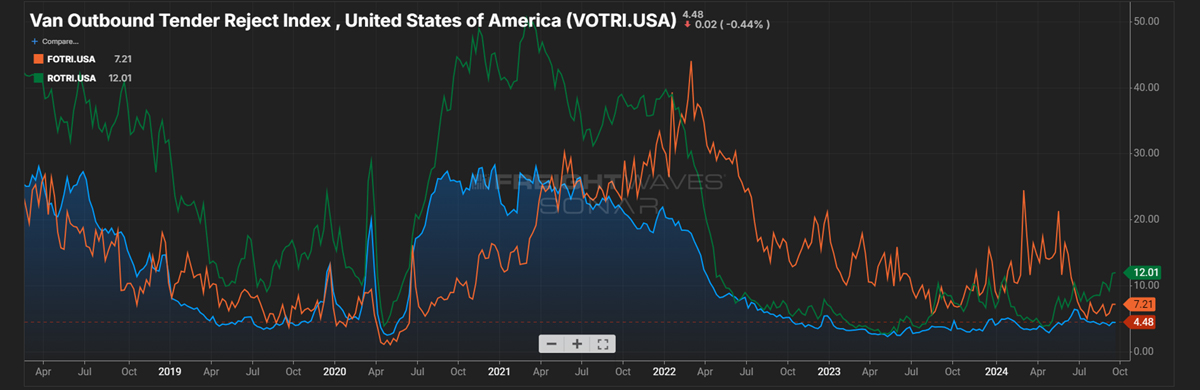
Outbound Tender Reject – All Modes
Overall Rejects still up over 2023 during this same time, but still tracking below the spike we saw in July. The impact of the Holiday season could increase the rejections as capacity tightens based on the overall volume.
Outbound Tender Reject – by Mode
Orange Line – Flatbed: Rejections have maintained steady since July. We have seen spikes from week to week, but nothing concerning and is in line with the overall outbound volume.
Green Line – Reefer: Rejections continue to climb slightly. Overall, the market remains stable with available capacity vs. previous years.
Blue Line – Van: Van Rejections took a slight jump in June/July but have remained relatively flat over the last few weeks.
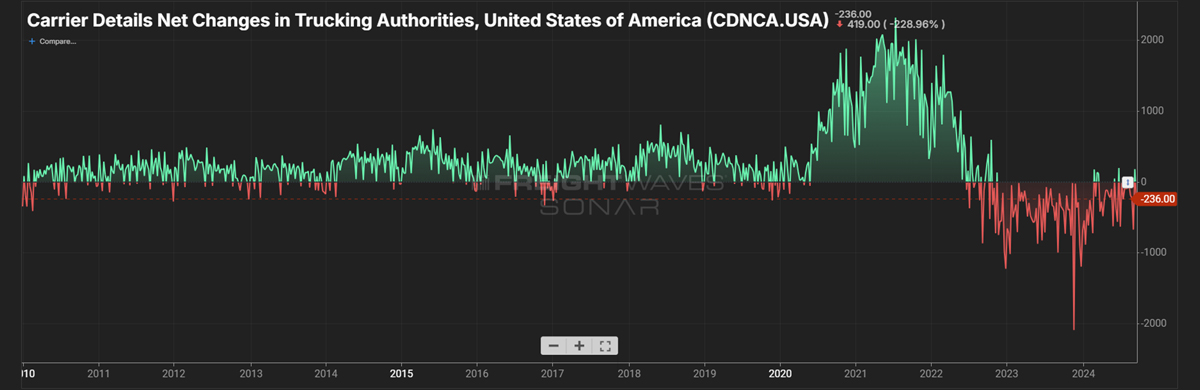
Carrier Authorities
This graph indicates we have less transportation companies coming into the market based on the current demand.
Carrier Authorities gone up and down but remain below the line. As the market increases its overall outbound volume, you will see this start to trend up.
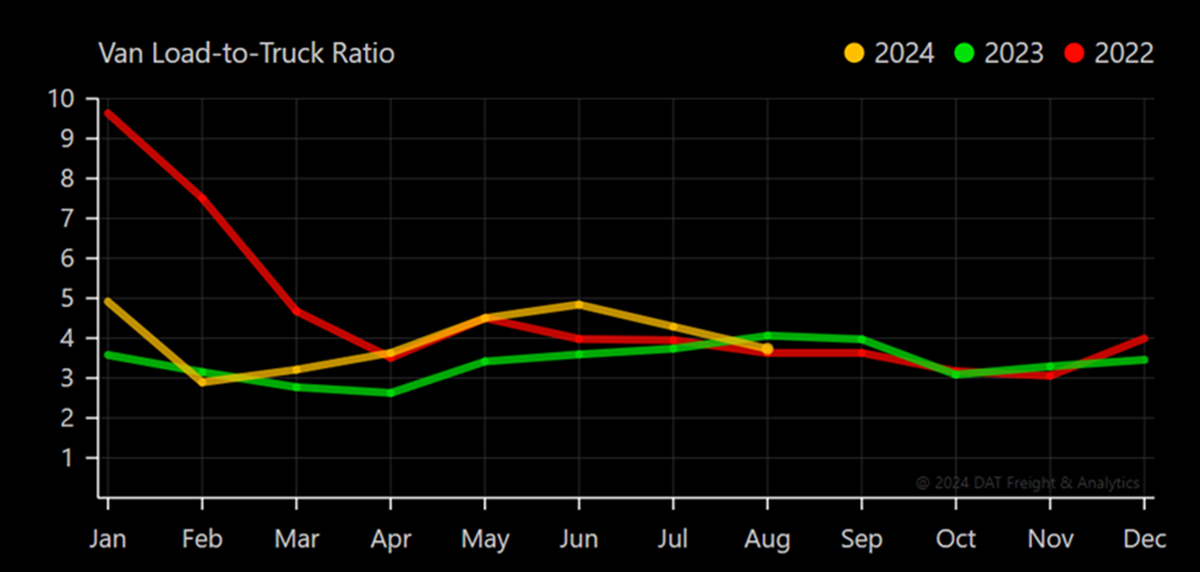
Van Load-to-Truck Ratio
Reefer Load-to-Truck Ratio
Flatbed Load-to-Truck Ratio
International
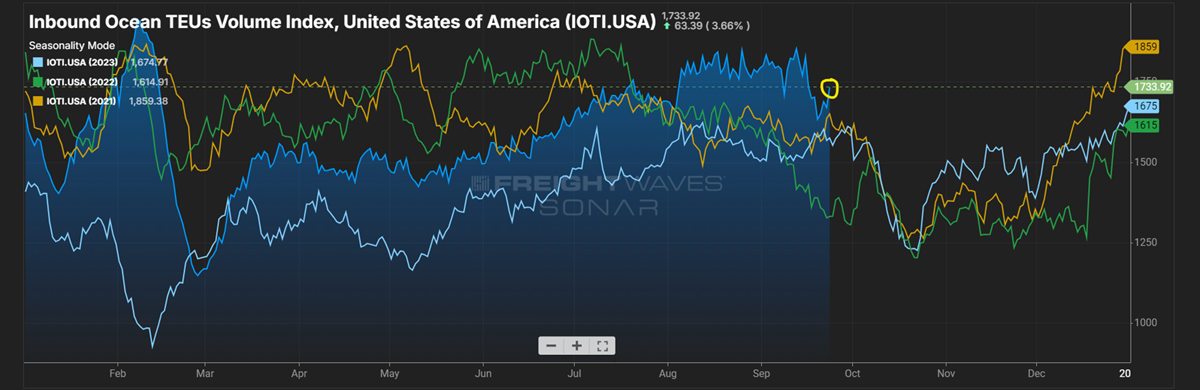
Inbound TEU volume climbs back up as we head into Q4. The overall volume since August has remained up over what we saw the last 4 years.
Ocean spot rates remain up based on congestion and container shortages.
ILA port strike is still pending an October 1 shutdown. Many big retail companies urge President Biden to intervene in the dock strike.
The ILA ports make up 53% of all U.S. apparel, footwear, and accessories.
Canadian News
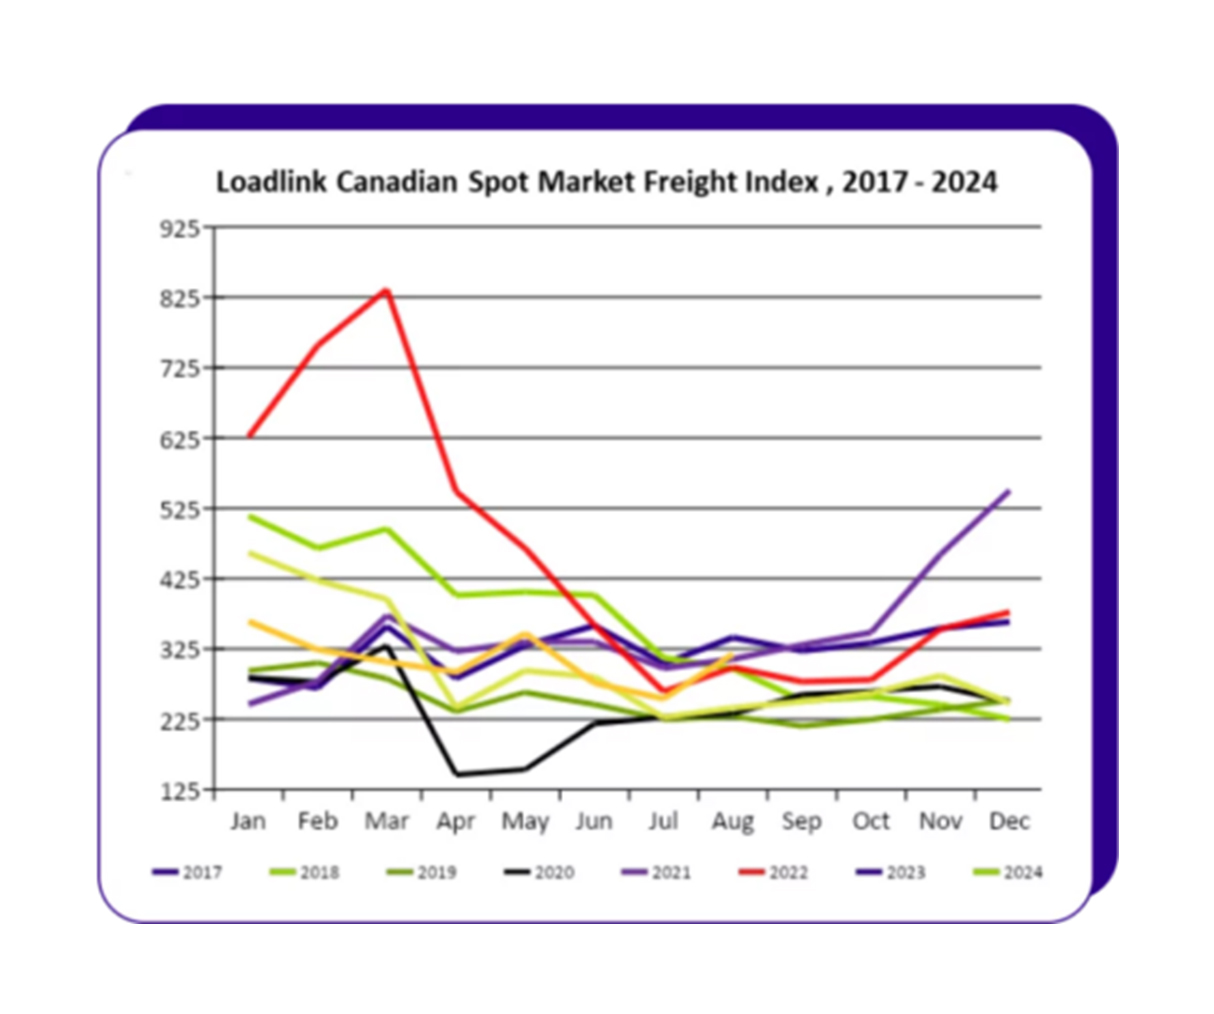
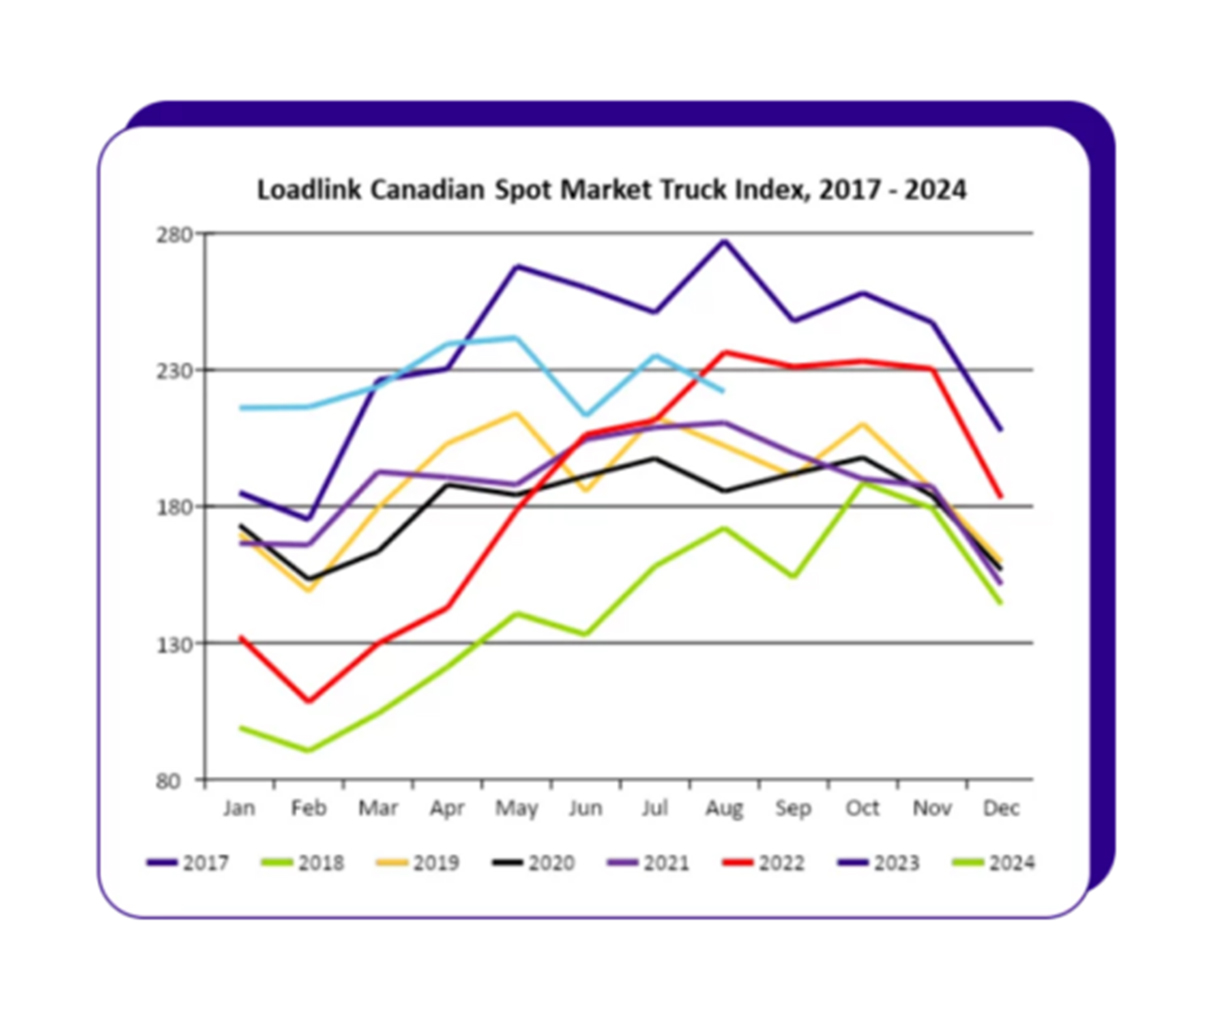
Posted loads jumped 32% over last month, but equipment postings were down 20% against levels a year ago.
Spot rates dropped slightly over last month by 0.9%.
Demand up 19.6%, and capacity is still up 18.3%.
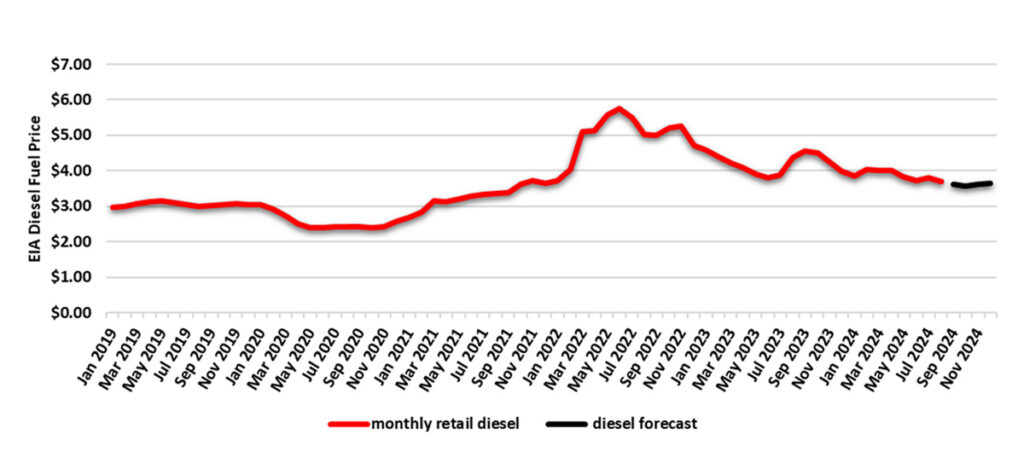
Fuel Forecast – DOE
Average diesel fuel retail prices for 2023 averaged at $4.214/gallon through Q4 2023 and Q1 2024 fuel finished at an averaged $3.973/gallon. Fuel for Q2 finished at $3.849/gallon, Q3 is currently averaging $3.710/gallon, and Q4 is forecasted to come in around $3.607/gallon.
Energy Information Administration Diesel Fuel Prices January 1, 2019 – August 31, 2024
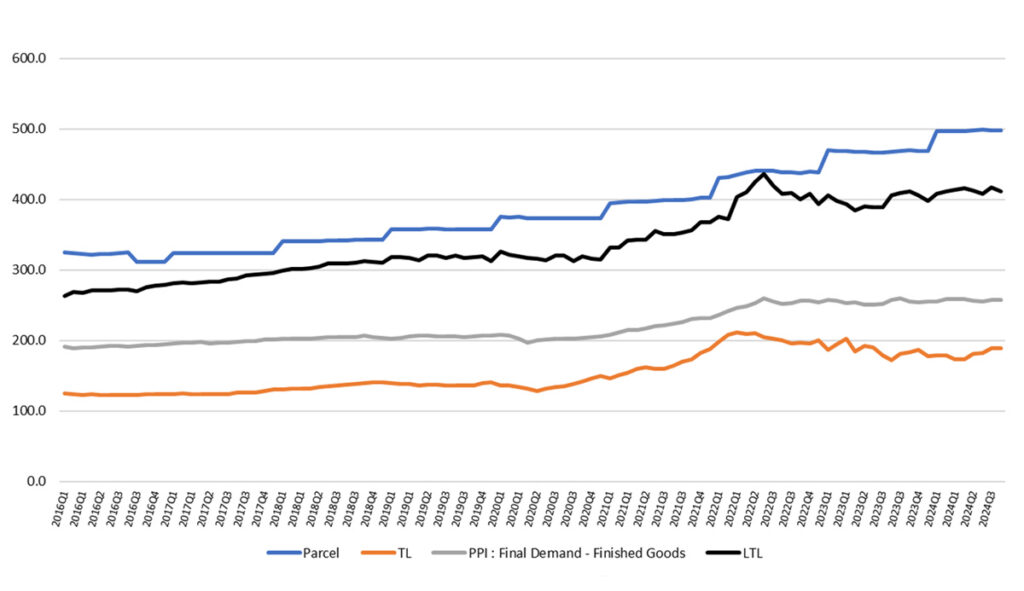
Price Index Performance: 2016-2023, By Quarter, Through August Q3 2024
State of the U.S. Transportation Market
What Does This Data Mean?
The Producer Price Index (PPI) is a family of indexes that measures the average change in selling prices received by domestic producers of goods and services over time. PPIs measure price change from the perspective of the seller. In other words, the PPI measures the trend of the cost of everything Manufactured in the United States
Talk to a team member
A brief, 15-minute meeting with a DLX shipping solutions team member, scheduled based on your availability.