Shippers should prepare for potential disruptions and increased rates as we head into the Holiday season.
Demand will remain stable to slightly down until we get closer to the Holiday season.
Retail sales rose 0.6% in October, and 5% year-over-year.
Tariff-related delays may impact production, putting pressure on prices.
The Middle East tension has pushed some concerns around the oil volatility in the market.
Labor market: Private employers added 42,000 jobs in October; this is a rebound of 2 consecutive months of decline.
Unemployment at 4.36%, up 4.14% a year ago.
30-year fixed mortgage is at 6.27% in October.
15-year fixed mortgage is at 5.58%.
LTL
Current Market
LTL is still experiencing a soft market; the down market is reflective based on lower manufacturing and more cautious consumer spending.
Even with demand being down, soft carrier capacity is slowly leaving the market, which could have an effect on continued price increases.
LTL carriers have implemented GRI’s (General Rate Increases) around 4-7% despite the down market.
NMFC reclassification updates are changing the LTL pricing is shifting to more of a density-based program.
It is very important to get a better understanding of your dimensions to avoid additional cost.
Key Takeaways
Look to lock in contractual pricing were appropriate.
Review your packaging and dimensions to take advantage of the density-based pricing.
Continue to build carrier relationships as the market continues to make changes.
Invest or partner with a company to better utilize automation to help control cost.
Truckload
Current Market
Carrier continues to grow tighter even as we see the outbound tender volume decrease.
Regulatory changes, such as the new CDL rule, and increased operating cost for carriers, we expect capacity to continue to tighten in 2026.
Tariffs on truck parts and as well as imported goods are raising cost for truckload fleets.
Factors on increased carrier costs which is influencing the smaller carrier pushing them out of the market.
Driver wages up 7.6%
Insurance up 12.5%
Equipment costs up 8.8%
Key Takeaways
The TL market is at risk due to increased costs and lack of capacity.
Technology will be key to driving compliance with core carriers.
Start your planning now! Find a partner that can provide you with technology, visibility, and sustainability in a volatile market.
Reefer rates rise ahead of Thanksgiving
Outbound Tender Volume – All Modes
Outbound tender volume remains relatively flat as we get closer to Thanksgiving. Outbound volume continues to trend down vs. previous years.
Outbound Tender Reject – All Modes
Overall Rejects still slightly up vs. last year even with less outbound volume.
Capacity sill playing a large role in the overall rejections remaining higher in 2025.
Outbound Tender Reject – by Mode
Orange Line – Flatbed: Rejections trend along with last year at this same time.
Very important to keep a close eye on the overall outbound volume to ensure you are securing capacity in this market.
Green line – Reefer: Rejections for Reefer up slightly this month vs. last month.
Similar to flatbed, increased outbound volume will have a significant impact on capacity in the Reefer space.
White line – Van: Van Rejections up this month vs. last month.
Rejections continue to fluctuate month- over-month but still remain flat since the start of this year.
Carrier Authorities
This graph indicates we have less transportation companies coming into the market based on the current demand.
Authorities continue to drop which is causing rejections to increase despite the overall volume decrease compared to 2024.
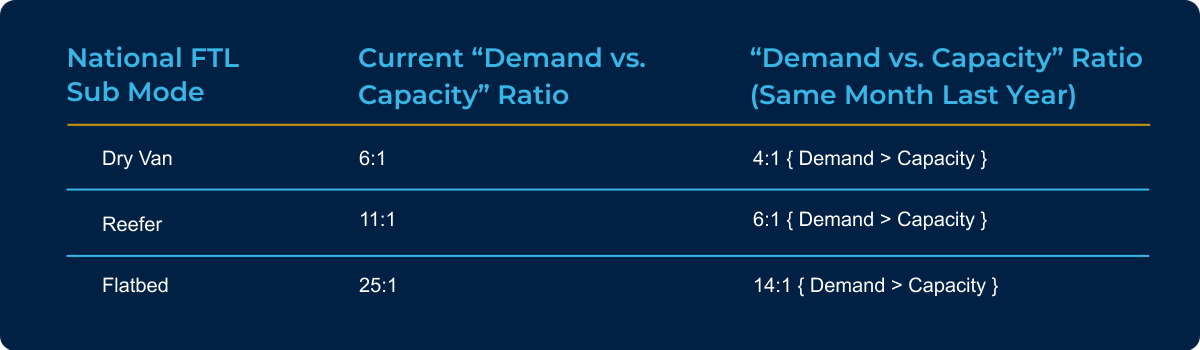
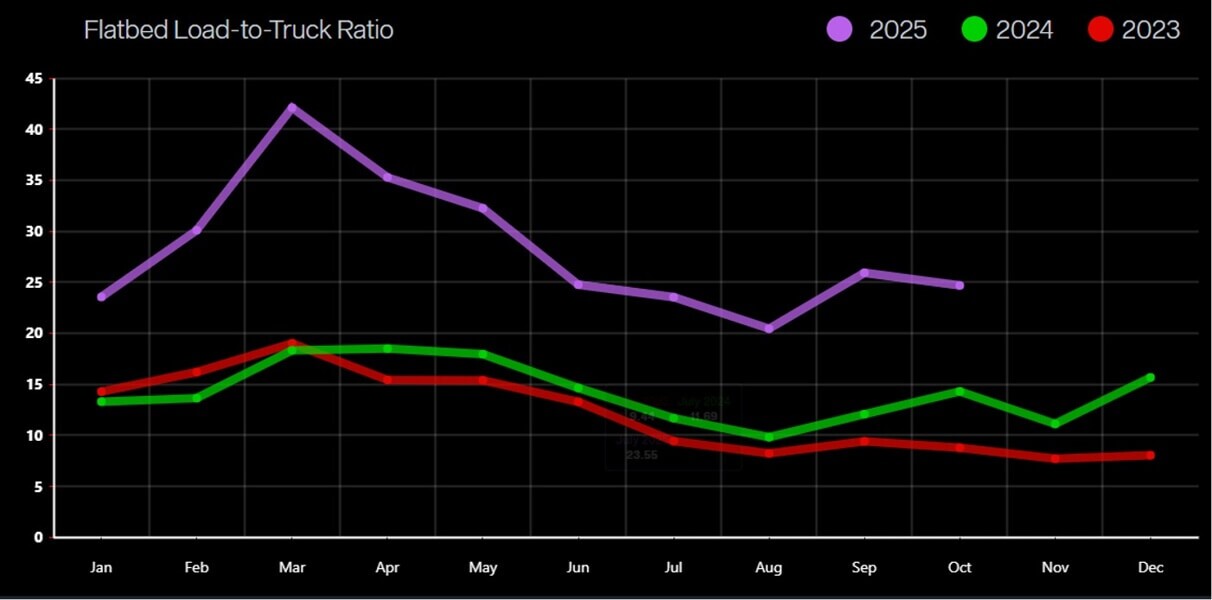
Demand vs. Capacity Metrics – October 2025
Van Load-to-Truck Ratio
Reefer Load-to-Truck Ratio
Flatbed Load-to-Truck Ratio
International
Current Market
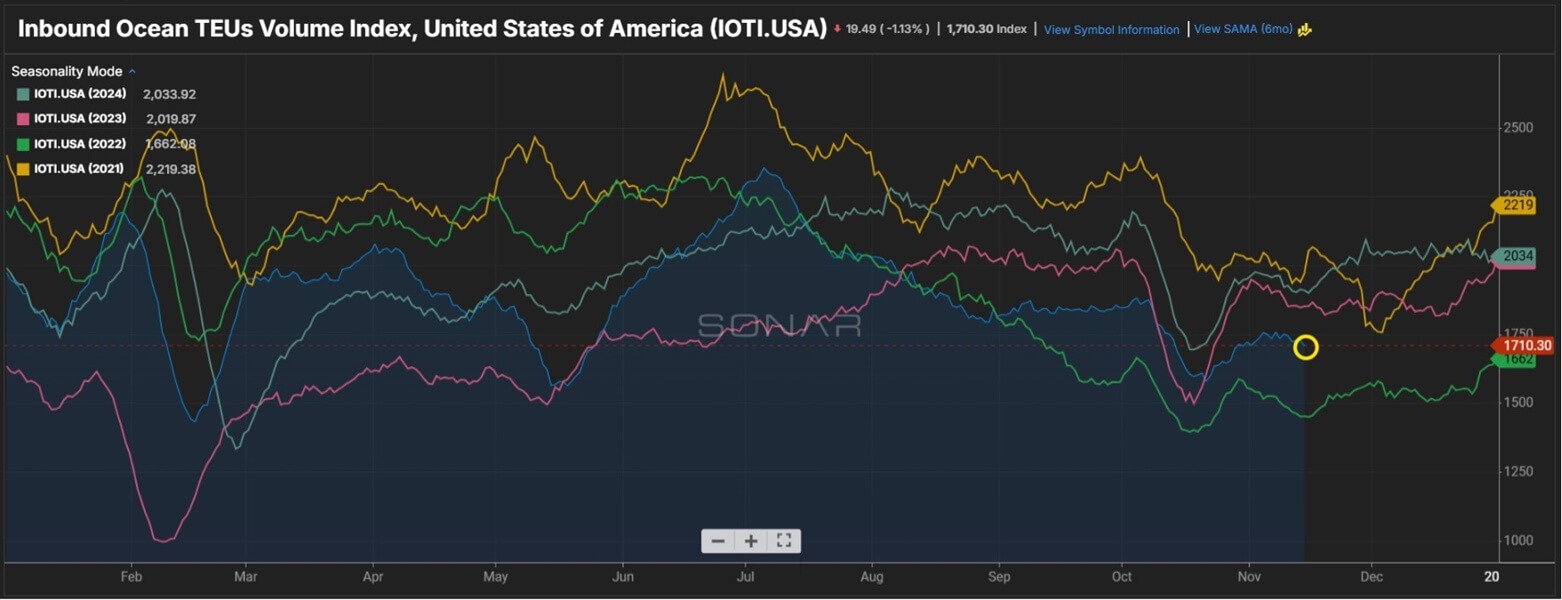
U.S. imports are expected to fall in the double digits in Q4.
Capacity improved by 7%, but still down 15% year-over-year.
Ocean rates rebounded in October by 39% but remain 44% below last year.
U.S. – China tariffs have had a significant impact on eastbound volumes.
TEU volume down 0.1% vs. September, but down 7.5% year-over-year
Key Takeaways
Secure space early when moving ocean freight to help control the cost.
Consider mini bids to help control the volatility of the market.
Factor in tariff-driven costs that are having an impact on heavy international lanes.
Cross Border
Mexico exports to the U.S. have surged 13.8% year-over-year
Inbound to Canada stronger than outbound; cross-border freight accounts for 65% of all Canadian spot posts.
Rates generally stable, but demand still down based on a weaker U.S. retail and manufacturing productivity.
Weather will continue to be a major factor in Canada as we get closer to winter.
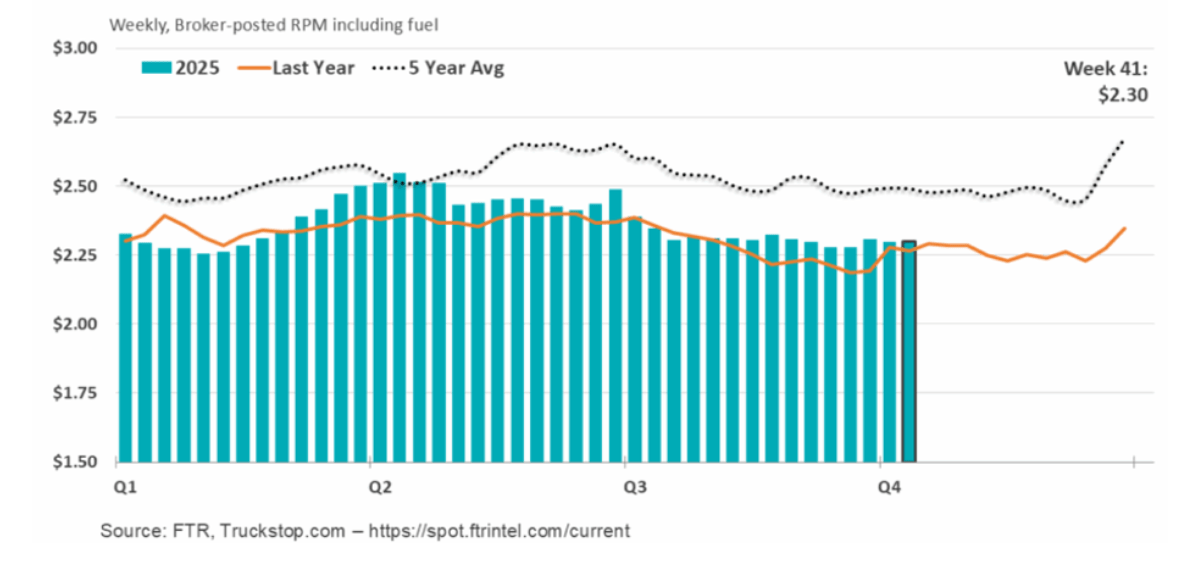
Total Spot Rates
Fuel Forecast – DOE
2024 diesel fuel retail prices averaged $3.761/gallon through Q4 2024 and Q1 2025 finished lower at an average $3.631/gallon, and Q2 finished at $3.555/gallon.
Fuel for Q3 finished at $3.757/gallon and Q4 is tracking $3.694/gallon to close out 2025.
Energy Information Administration Diesel Fuel Prices January 1, 2020 – September 31, 2025
Talk to a team member
A brief, 15-minute meeting with a DLX shipping solutions team member, scheduled based on your availability.