U.S.-China and other trade deals paused most tariffs for 90 days.
U.S. tariffs dropped from 145% to 30%
Transportation and warehousing jobs grew.
Mortgage rates remain high at 6.81%, which continues to slow down buyer activity.
Rising construction costs, interest rates, and tariffs are major headwinds.
LTL
May LTL rates continue to remain strong.
LTL carriers continue to look at internal costs to help manage the external operations cost and market conditions.
Saia is moving all its customer service teams from their corporate office to its terminals.
Averitt Express partners with Best Overnight Express, a West Coast asset-based carrier.
This acquisition will improve service and transit times for Averitt to the West Coast.
Effective July 19th, 2025, the National Motor Freight Traffic Association (NMFTA) will roll out density-based classification for 3PLs.
Shippers will soon have to know the weight and dimensions of all handling units.
Organizations can prepare for this change by ensuring you have the proper dimensions and weights for all your LTL products.
Key Information for LTL shippers when requesting pricing:
Dimensions, Class, NMFC numbers, and weights are critical to obtain correct pricing on the front end of your shipment.
Truckload
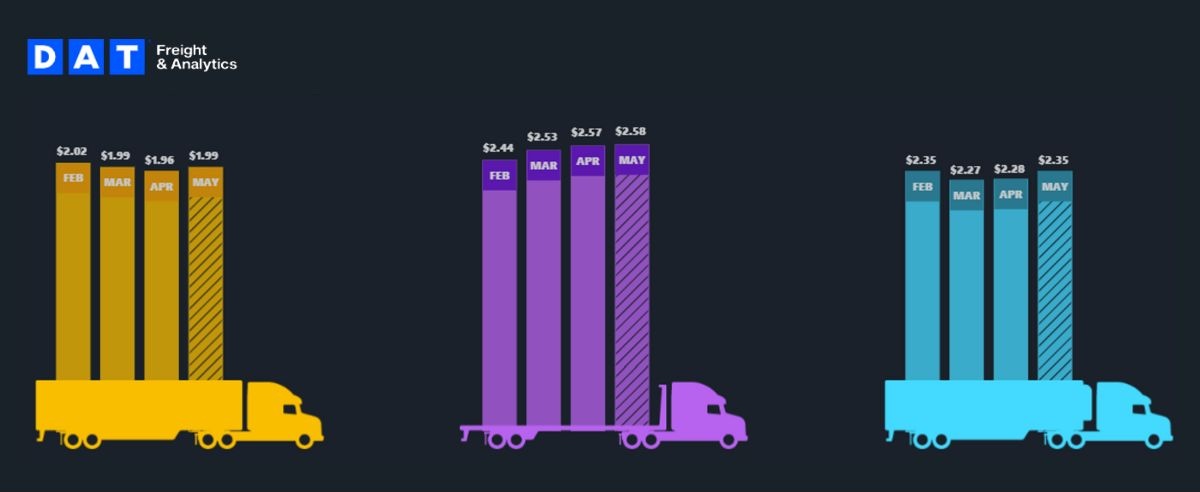
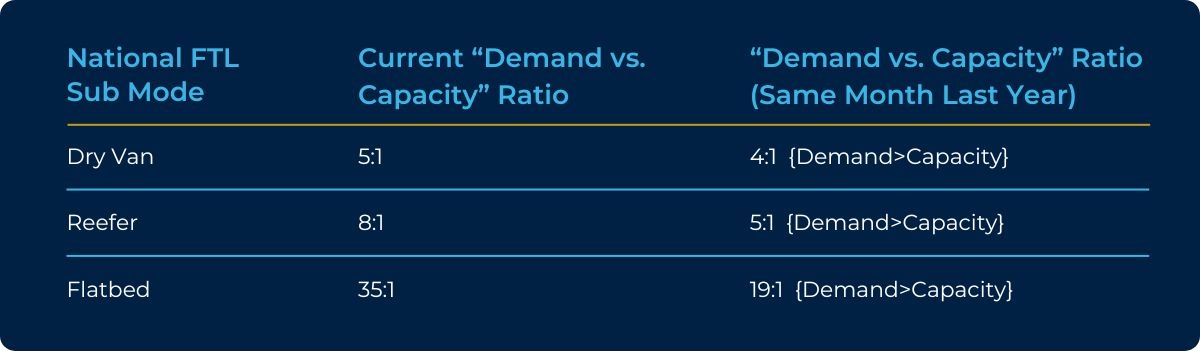
Van spot rates were up slightly (0.5%) vs. this same time last year and down slightly (0.5%) vs. last month.
Capacity grew tighter by 26.4% compared to last year but improved 7.1% compared to last month.
May Van contracted pricing is up $.43 per mile over the spot market.
Reefer spot rates decreased (0.4%) vs. last year but increased (0.4%) vs. last month.
Capacity grew tighter by 73.6% vs. last year and 16.5% vs. last month.
May Reefer contracted pricing is tracking up $.39 per mile over the spot market.
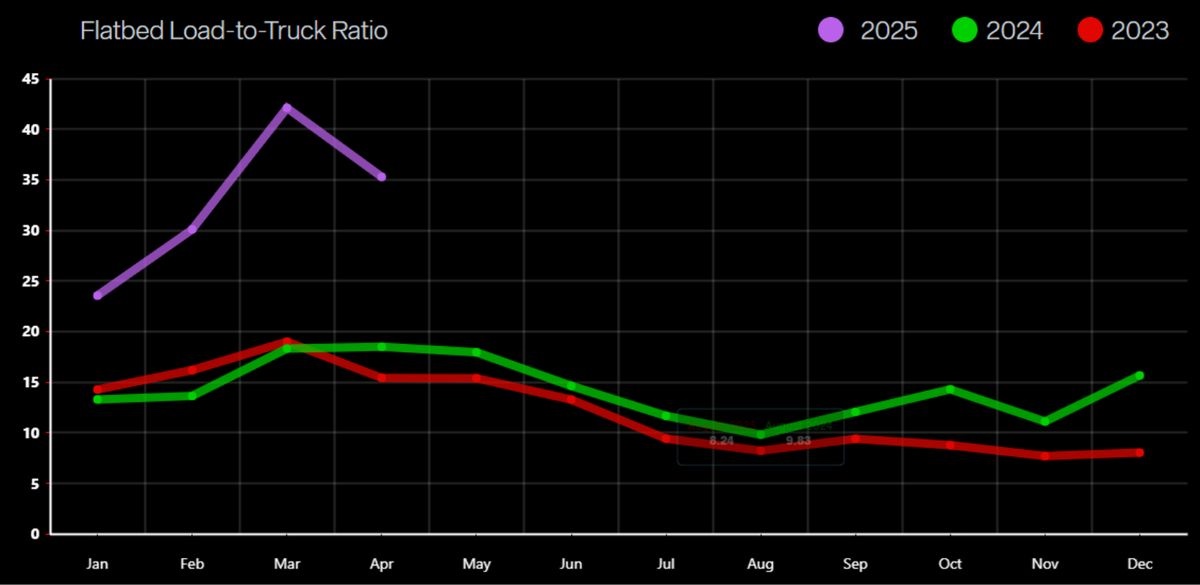
Flatbed spot rates increased (1.6%) vs. last year and (1.9%) vs. last month.
Capacity decreased by 90.7% vs. last year but improved by 16.2% over last month.
May Flatbed contracted pricing is tracking up $0.48 per mile over the spot market.
Volumes and prices slip further
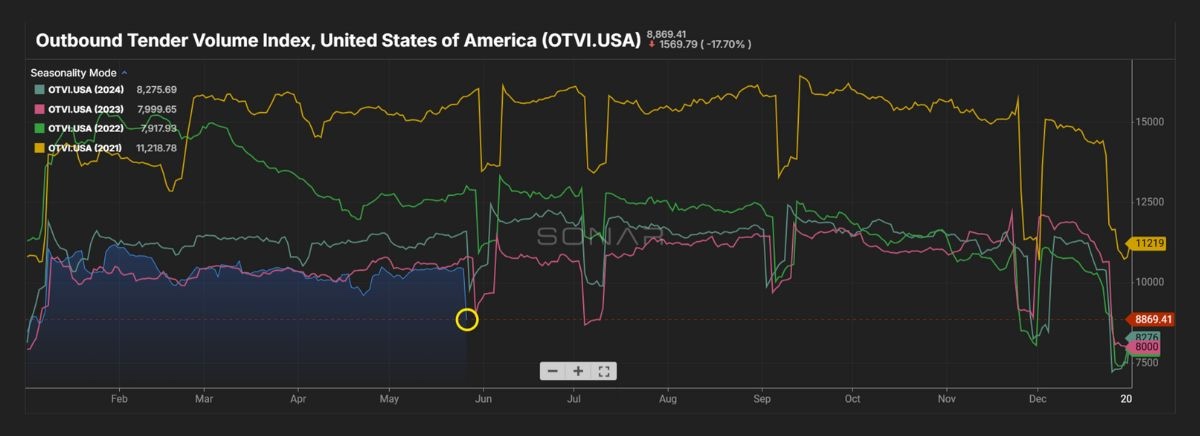
Outbound Tender Volume – All Modes
Outbound tender volume dropped below both 2023 and 2024 volumes. The lack of volume is still having an impact on pricing in the truckload market.
The drop in volume is a seasonal impact due to the Memorial Day weekend.
Outbound Tender Reject – All Modes
Overall Rejects continue to remain higher than in 2023 and 2024.
Capacity still reflects a tighter market over 2024, but the overall demand for freight is still low.
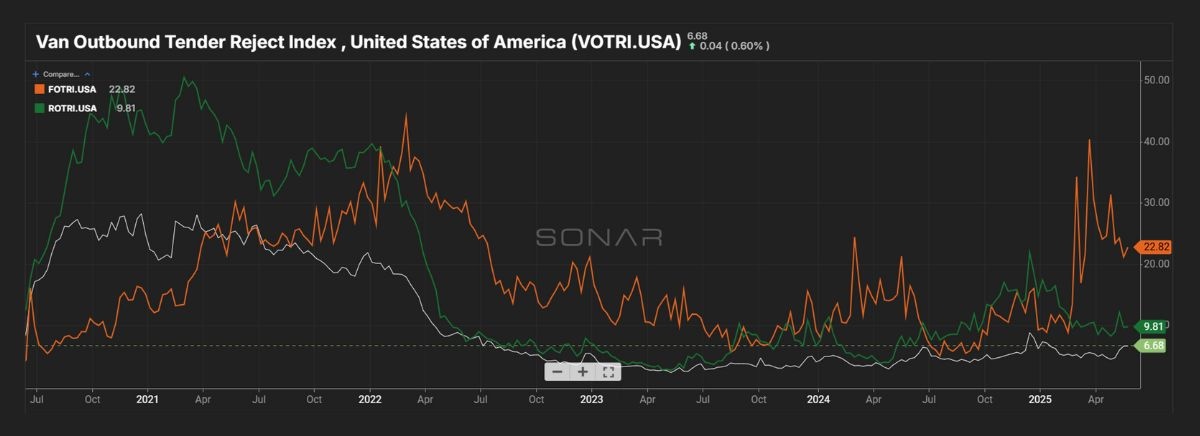
Outbound Tender Reject – by Mode
Orange Line – Flatbed: Rejections are up slightly over this same time last year.
Rejections fluctuated based on the volatility the current market is facing.
Green line – Reefer: Rejections for Reefer remain slightly higher compared to 2024.
As we head into produce season, we will keep a close eye on the impact this will have on rejections within the Reefer equipment.
White line – Van: Van Rejections are up slightly compared to 2024, but still are not having a large impact on capacity and rates.
Rejections jumped up in May but have continued to flatten out over the last two weeks.
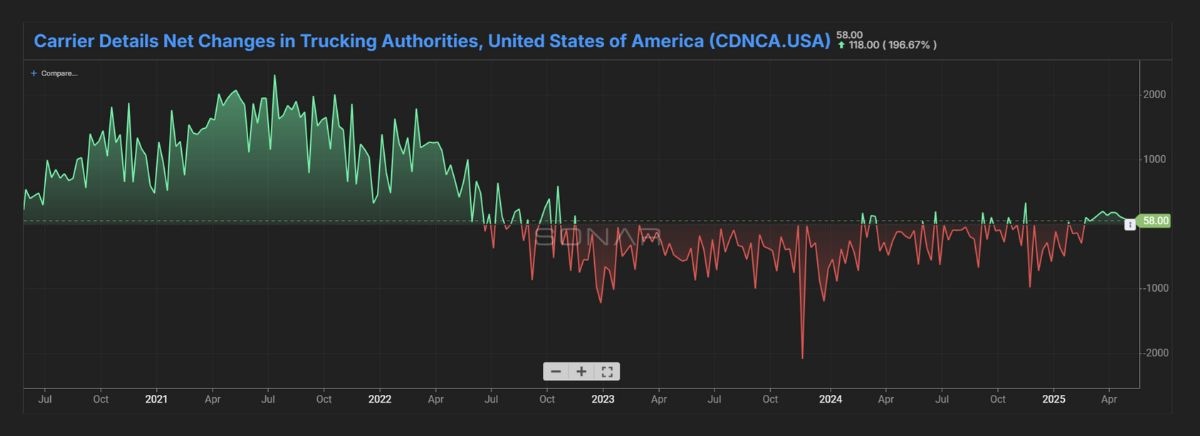
Carrier Authorities
This graph indicates we have less transportation companies coming into the market based on the current demand.
This is the 2nd month in a row carrier authorities remain up.
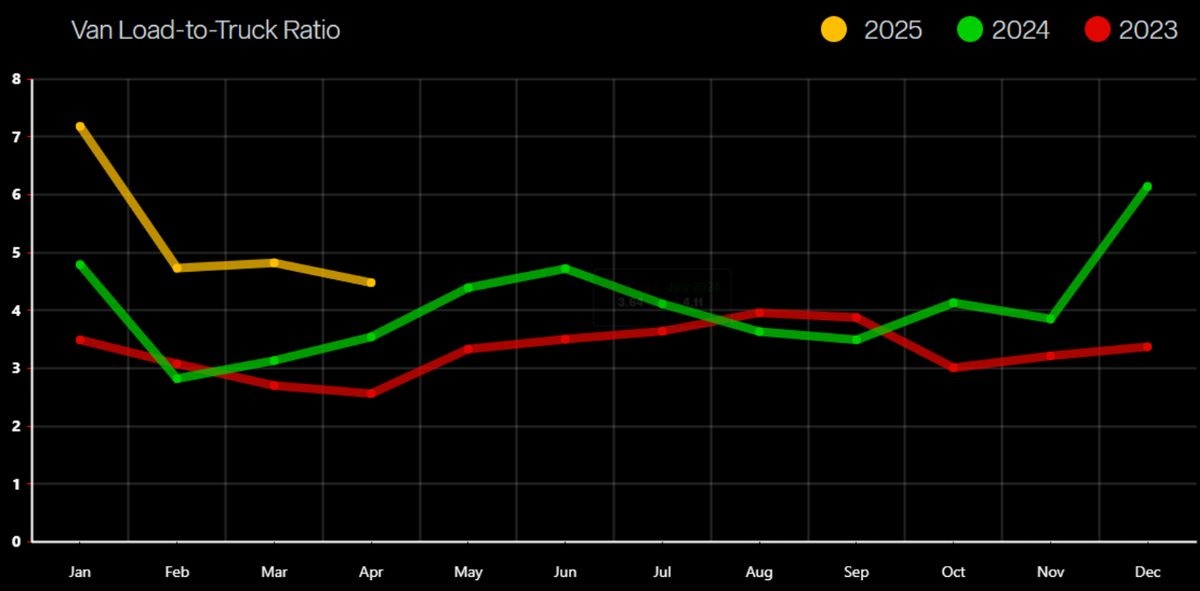
Van Load-to-Truck Ratio
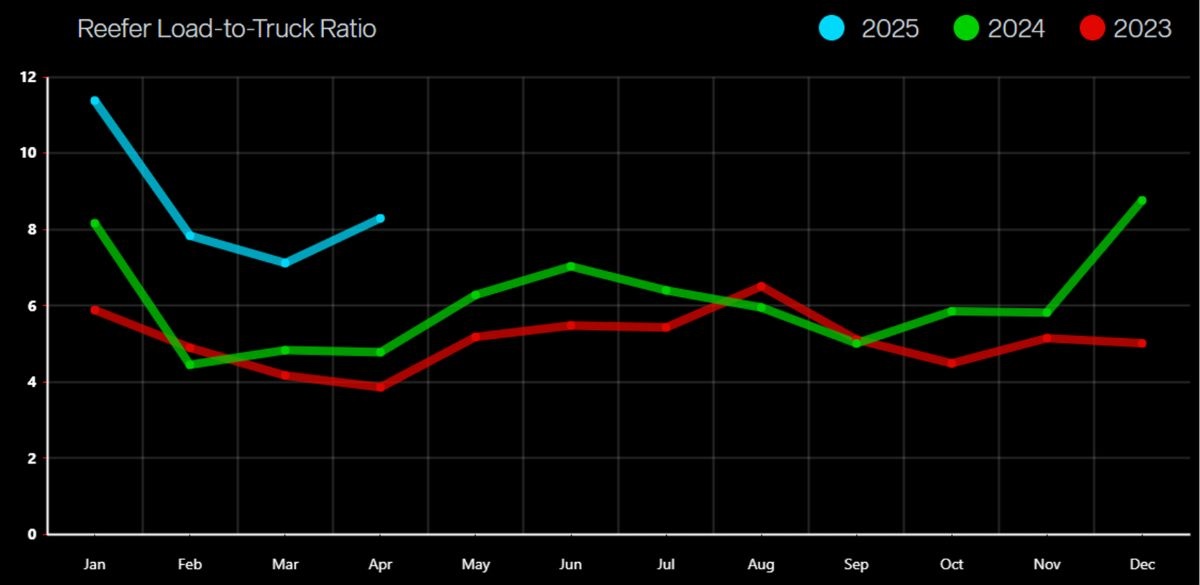
Reefer Load-to-Truck Ratio
Flatbed Load-to-Truck Ratio
International
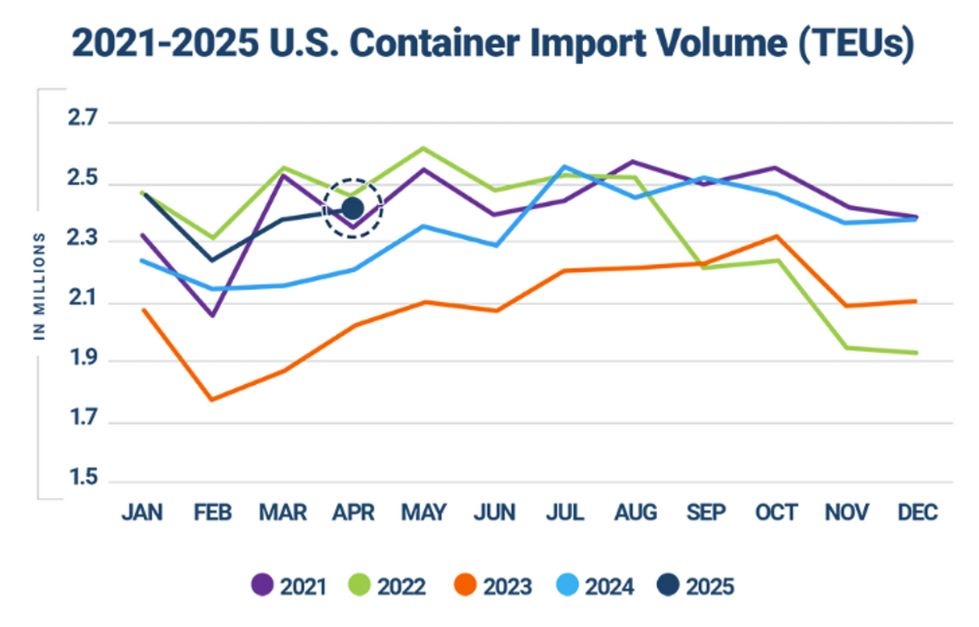
May inbound TEUs dipped below 2024 volumes.
“Liberation Day” (May 14 tariff cut) caused a drop in Chinese exports.
Bookings rebounded after the post-tariff announcement.
Spot rates rose (e.g., China-U.S. West Coast container rate was around $4,382).
S. Container import volume remains above 2024.
Ocean spot rates have dropped due to the increase in capacity.
Canadian News
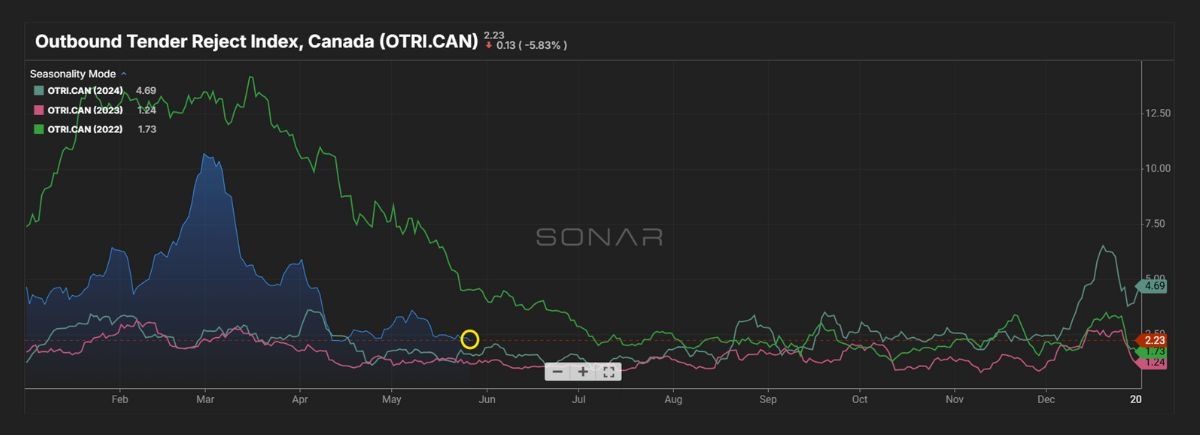
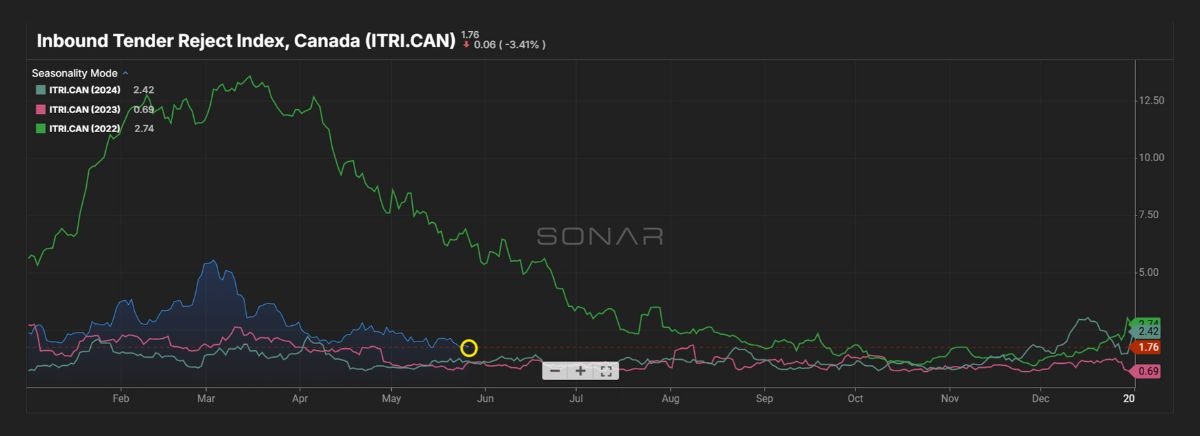
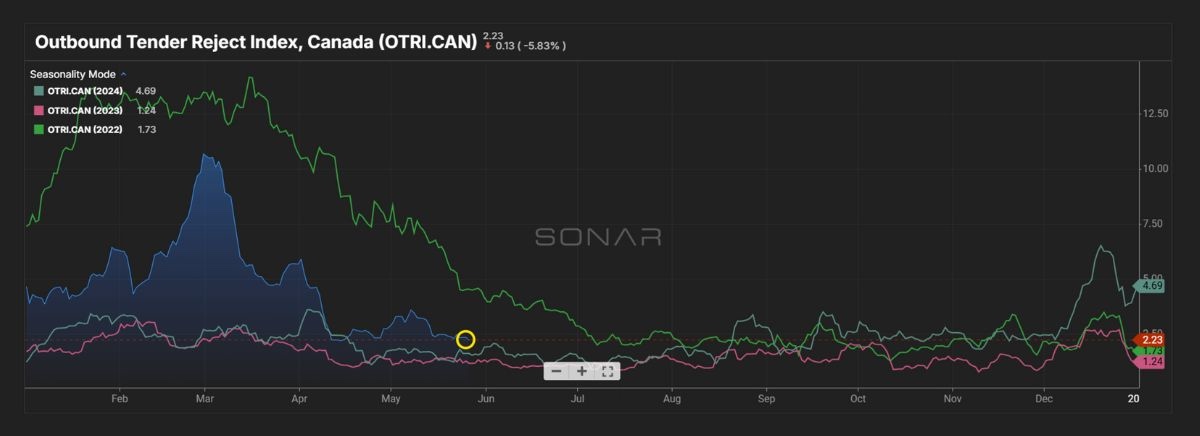
Outbound tender rejects saw a spike in May but have come back down as we look to head into June.
Inbound tender rejections remain relatively flat after the spike in early March.
Spot rates spiked during the week of May 16th due to the international road check inspections blitz.
Demand was up 34% while supply (trucks) was down 7.1%.
Truck orders plunged in April.
Fuel Forecast – DOE
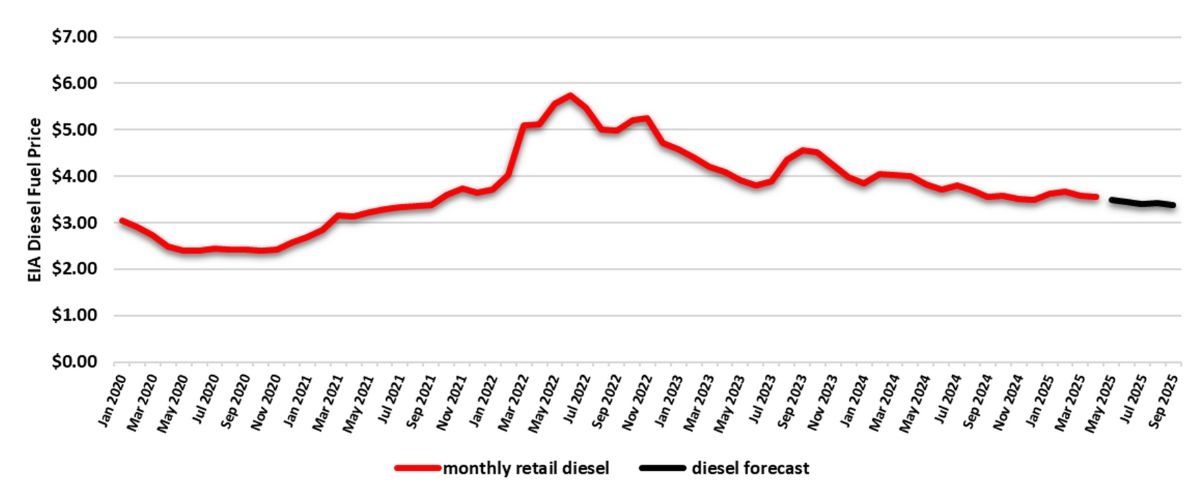
2024 diesel fuel retail prices averaged $3.761/gallon through Q4 2024 and Q1 2025 finished lower at an average of $3.631/gallon.
Fuel for Q2-Q4 of 2025 is forecasted at an average of $3.447/gallon.
Energy Information Administration Diesel Fuel Prices
January 1, 2020 – March 31, 2025
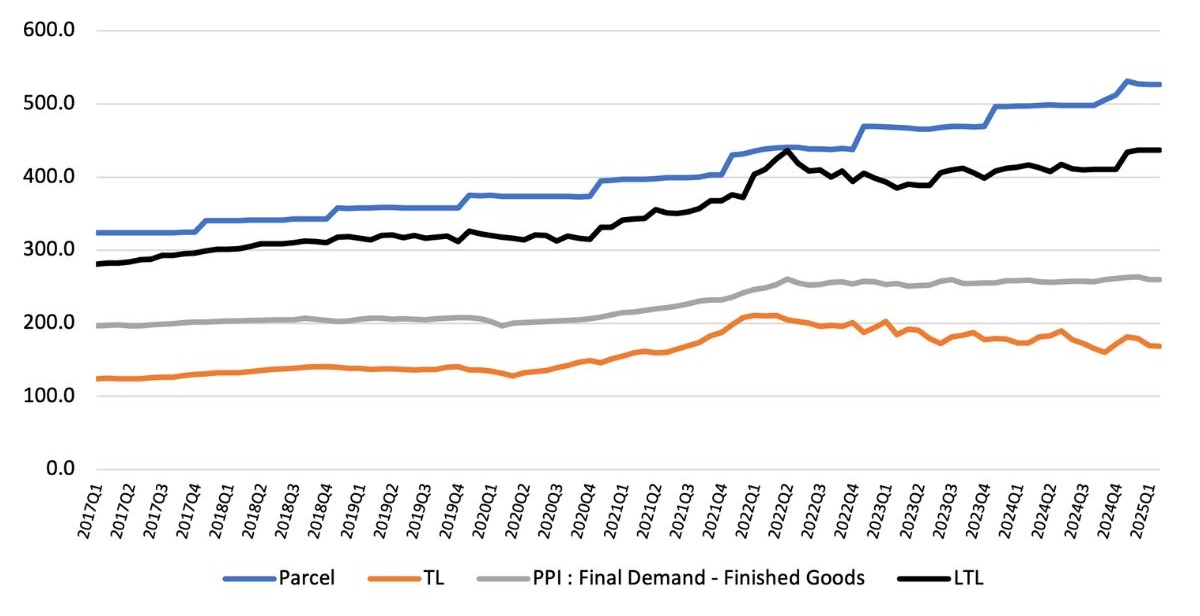
Price Index Performance: 2017 -2025, By Quarter, Through March Q1 2025
State of the U.S. Transportation Market
What Does This Data Mean?
The Producer Price Index (PPI) is a family of indexes that measures the average change in selling prices received by domestic producers of goods and services over time. PPIs measure price change from the perspective of the seller. In other words, the PPI measures the trend of the cost of everything Manufactured in the United States.
Talk to a team member
A brief, 15-minute meeting with a DLX shipping solutions team member, scheduled based on your availability.