Potential risks related to hurricane season (late August) and ongoing global trade talks are continuing to cause market uncertainty.
90-day U.S. China tariff pause expires on August 12.
50% tariffs on imports from Brazil, effective August 1.
25% tariffs on products from Japan and South Korea are also planned.
Labor market sees an increase of 147k jobs in June; unemployment rate down to 4.1%.
30-year fixed mortgage is sitting at 6.75%.
LTL
Saia shows improvement in Q2 after a slow start to 2025.
Tonnage went up 1.1% vs 2024 Q2.
Roadrunner adds over 100 new lanes and adds a Kansas City hub to their network.
The National Motor Freight Traffic Association (NMFTA) density-based classification for 3PLs rollout took place on July 19.
FedEx Freight extends new class rules changes to December 1.
Key Information for LTL shippers when requesting pricing:
Dimensions, Class, NMFC numbers, and weights are critical to obtain correct pricing on the front end of your shipment.
Truckload
Van spot rates were up slightly (0.5%) vs. this same time last year and remained flat (0.0%) vs. last month.
Capacity grew tighter by 22.7% compared to last year and remained relatively flat (0.1%) compared to last month.
July van contracted pricing is up $.37 per mile over the spot market.
Reefer spot rates decreased (1.3%) vs. last year and (0.4%) vs. last month.
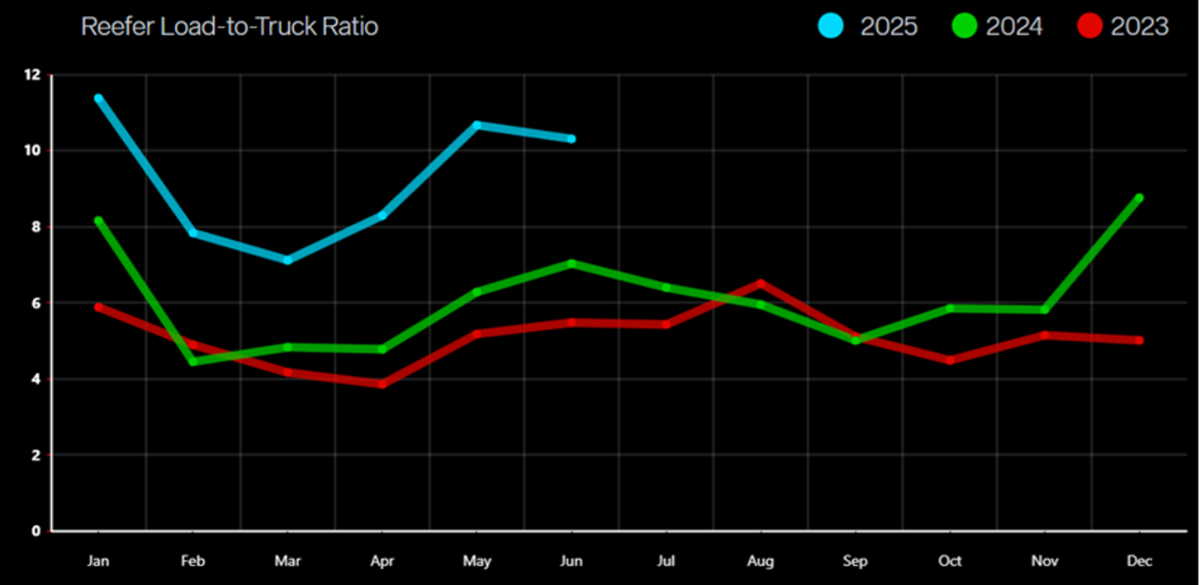
Capacity grew tighter by 46.7% vs. last year but improved 3.4% vs. last month.
July reefer contracted pricing is tracking $.36 per mile above the spot market.
Flatbed spot rates increased (1.6%) vs. last year but remained flat (0.0%) vs. last month.
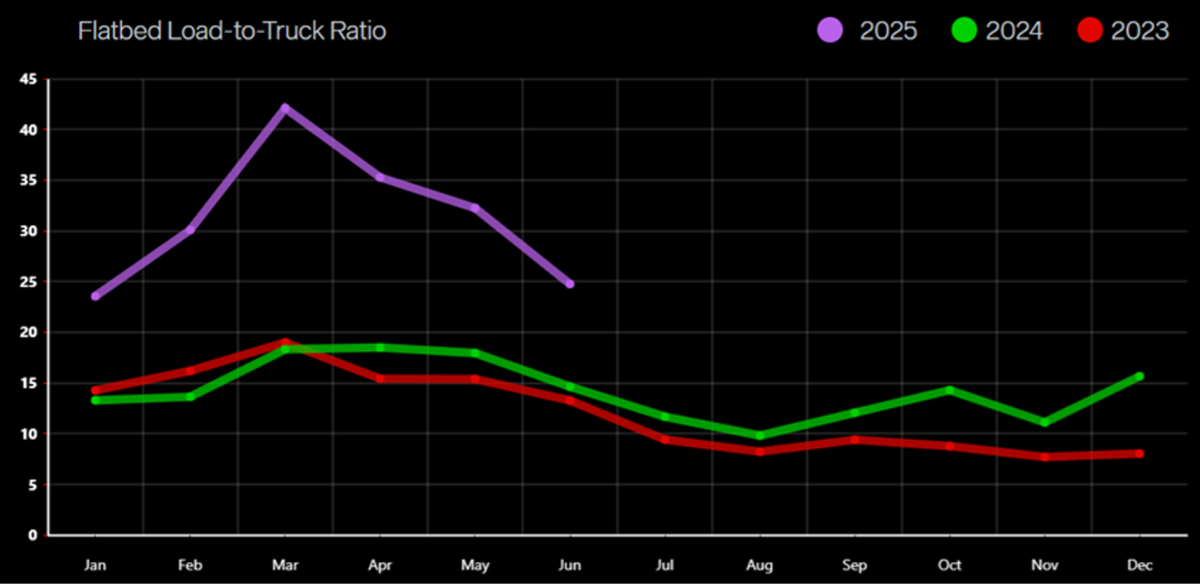
Capacity decreased by 69.1% vs. last year but improved by 23.2% over last month.
July flatbed contracted pricing is up $0.56 per mile over the spot market.
Outbound Tender Volume – All Modes
Outbound tender volume is still trending below 2023 and 2024 volumes. The lack of volume is still having an impact on pricing in the truckload market.
Outbound Tender Reject – All Modes
Overall Rejects continue to remain higher than 2023 and 2024.
Capacity still reflects a tighter market over 2024, but the overall demand for freight is still low.
Outbound Tender Reject – by Mode
Orange Line – Flatbed: Rejections are up vs. this same time last year.
Rejections fluctuated based on the current market uncertainty.
Green line – Reefer: Rejections are improving, but still higher than this time last year.
Keep a close eye on your carrier capacity as we head into the hottest part of the year.
White line – Van: Rejections remain up slightly vs. 2024 but still are not having a large impact on capacity and rates.
Rejections continue to fluctuate month over month, but remain flat since the start of this year.
Carrier Authorities
This graph indicates we have less transportation companies coming into the market based on the current demand.
Authorities dropped vs. 2024 even with less outbound freight.
Van Load-to-Truck Ratio
Reefer Load-to-Truck Ratio
Flatbed Load-to-Truck Ratio
International
Port of LA had a record June; July may mark 2025 peak.
Imports from China decreased 11% since early July.
Spot rates are dropping due to weaker demand as well as added capacity.
Inbound TEUs jumped over the June 2024 mark.
Ocean volume is up 28.8% MoM and right at 0.55% YoY.
S. Container import volume increased slightly over May by 1.8%
Canadian News
Outbound tender rejects continue to dip as we head into the last week of July.
Inbound tender rejections remain flat as we head into the end of July.
Truck orders jumped in June compared to May.
Spot rates also jumped slightly (1.7%) vs. May.
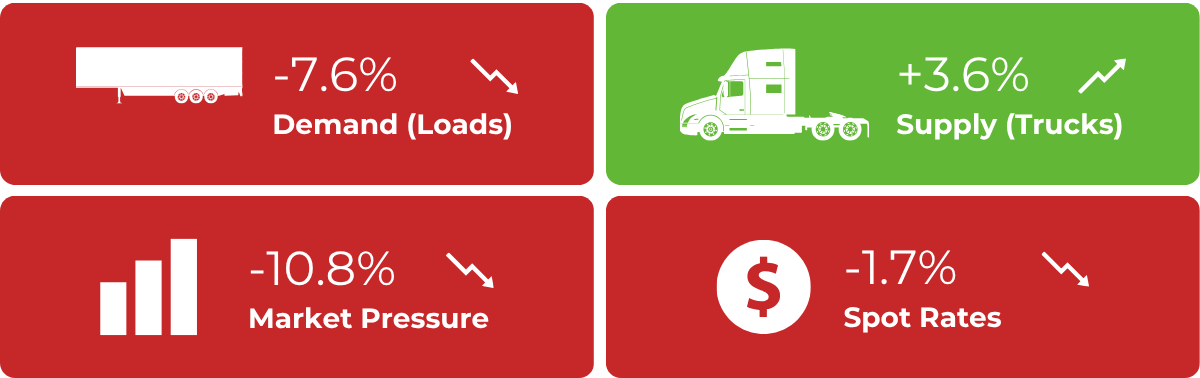
Spot Market Insights
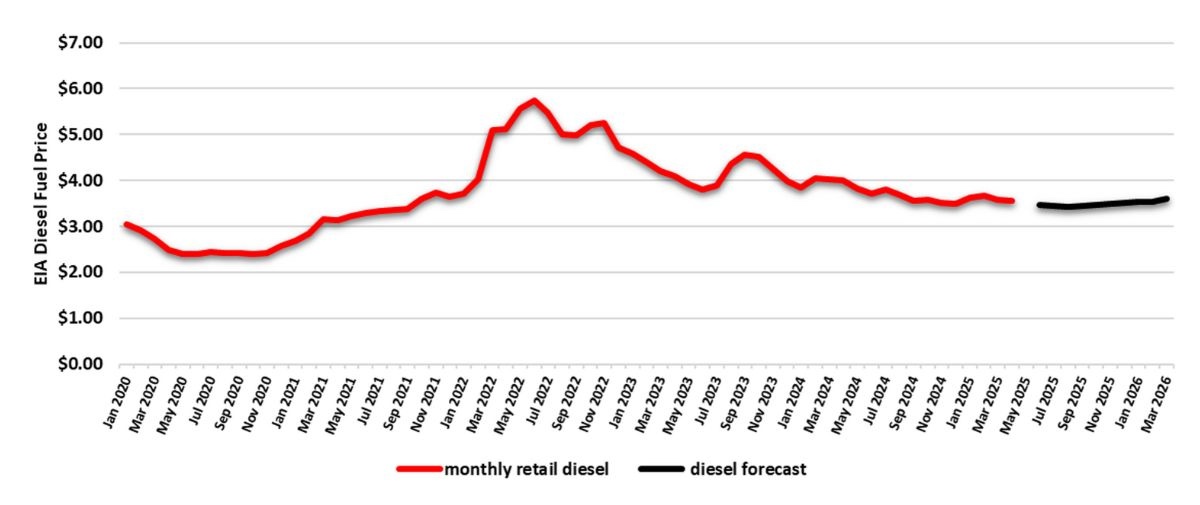
Fuel Forecast – DOE
Q1 2025 finished at an average of $3.631/gallon and Q2 finished at an average of $3.555/gallon.
Fuel for Q3-Q4 of 2025 is forecasted at an average of $3.630/gallon.
Energy Information Administration Diesel Fuel Prices
January 1, 2020 – June 30, 2025
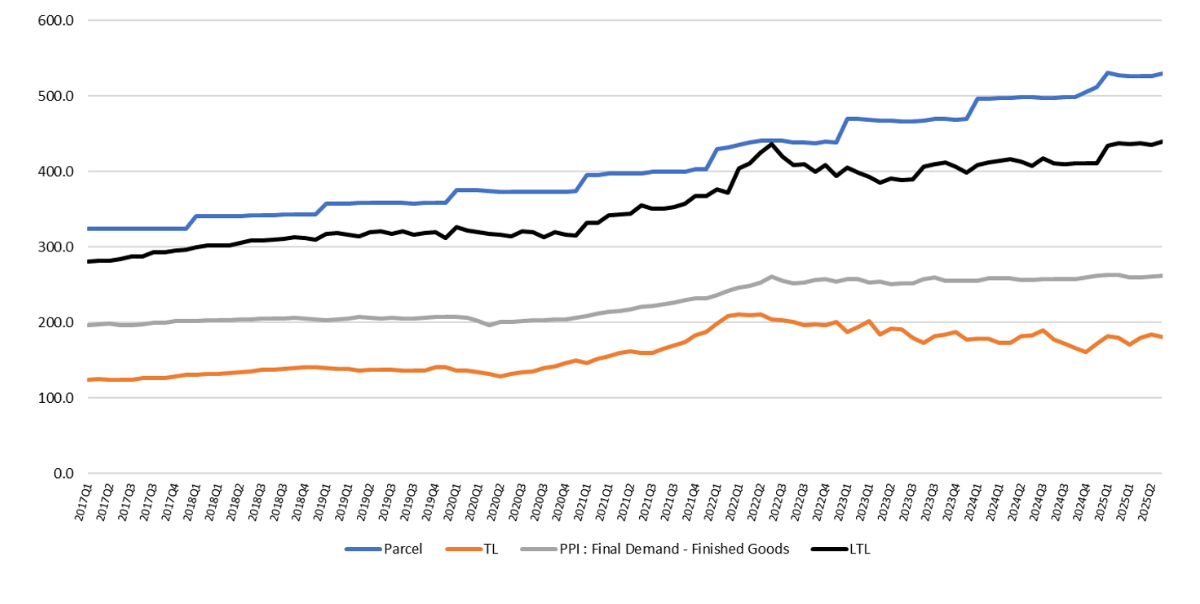
Price Index Performance: 2017 -2025, By Quarter, Through June Q2 2025
State of the U.S. Transportation Market
What Does This Data Mean?
The Producer Price Index (PPI) is a family of indexes that measures the average change in selling prices received by domestic producers of goods and services over time. PPIs measure price change from the perspective of the seller. In other words, the PPI measures the trend of the cost of everything Manufactured in the United States.
Talk to a team member
A brief, 15-minute meeting with a DLX shipping solutions team member, scheduled based on your availability.