Colder weather is here, and snowstorms across the country are causing issues.
Plan, secure capacity sooner, & add transit days to buffer delays
Capacity remains relatively high coming off the Holidays.
July 22nd market gained relief after President Trump withdrew his threat to impose sweeping tariffs.
Retail spending rose in December 0.6% vs. November.
Labor market:
Unemployment fell to 4.40% in December.
Forecasts predict unemployment to peak near 4.5% in early 2026.
30-year fixed mortgage ranges from 5.99%-6.13%
15-year fixed mortgage ranges from 5.37%-5.57%
LTL
Current Market
Despite a weak demand the LTL industry will still see rate increases in 2026.
Costs continue to increase for carriers causing an adjustment on rates.
Record high LTL rates in Q4 of 2025, cost per shipment remains 40% above 2018 levels.
LTL carriers are focused on network discipline rather than volume.
A. Duie Pyle expands with an LTL hub near Port of Virginia
NMFC reclassification updates are changing the LTL pricing is shifting to more of a density-based program.
It is very important to get a better understanding of your dimensions to avoid additional cost.
Key Takeaways
Demand remains weak, keeping volume soft for LTL carriers.
Rates will continue to rise.
LTL market is stable but weak heading into 2026.
Review your packaging and dimensions to take advantage of the density-based pricing
Continue to build carrier relationships as the market continues to make changes
Invest or partner with a company to better utilize automation to help control cost.
Truckload
Current Market
Demand is still weak in the TL market but showing early signs of stabilizing.
Capacity continues to tighten for the TL market.
Tender Rejection by Mode:
Van – Current Rejection rate is 9.1%
Reefer – Current Rejection rate is 15.3%
Flatbed – Current Rejection rate 18.2%$
Freight volume remains down as we kick off 2026.
Capacity remains tight, increasing the spot rates in the market.
Contracted pricing begins to shift as the carriers start chasing the higher spot rates.
Key Takeaways
Demand is soft but not collapsing
Capacity is shrinking quickly
Spot rates continue to rise.
Technology will be key to driving compliance with core carriers.
Start your planning now! Find a partner that can provide you with technology, visibility, and sustainability in a volatile market.
SONAR
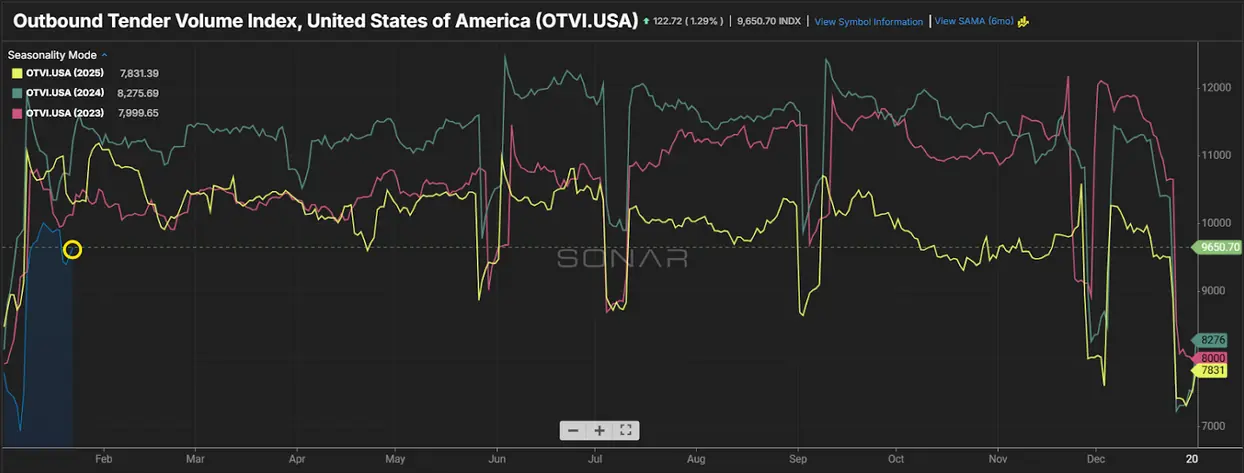
Outbound Tender Volume – All Modes
Outbound tender volume jumps back up in January, but still down vs. this same time last year.
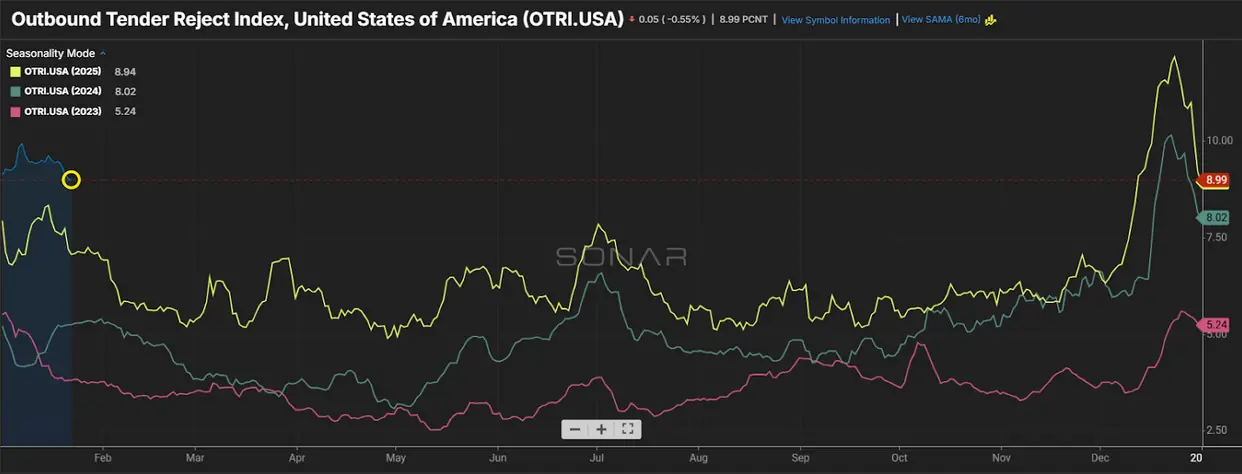
Outbound Tender Reject – All Modes
Overall Rejections remain high as we head into 2026.
Capacity remains the number one reason for the rejections across all modes.
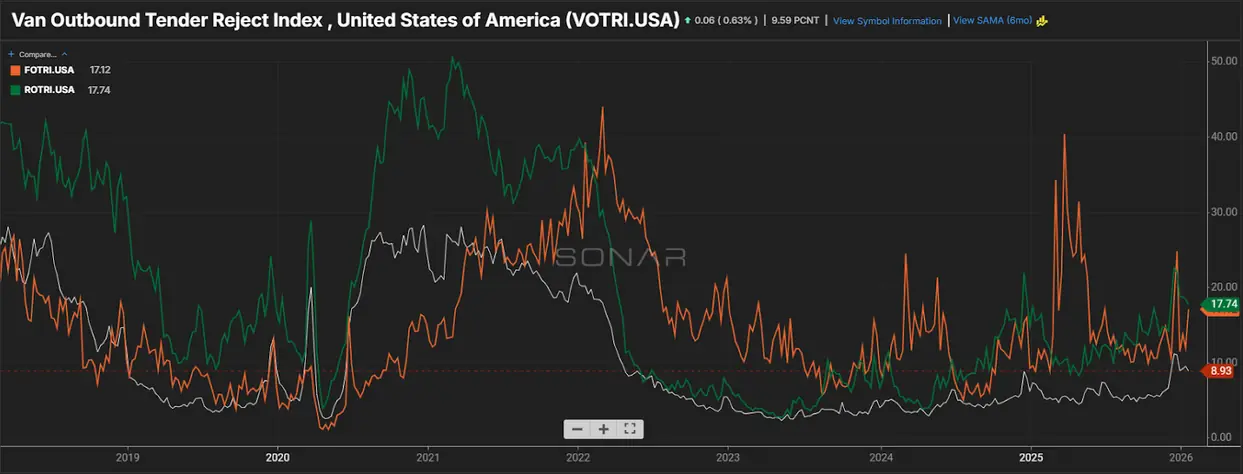
Outbound Tender Reject – by Mode
Orange Line – Flatbed: Rejections up vs. this same time last year.
Very important to keep a close eye on the overall outbound volume to ensure you are securing capacity in this market.
Green line – Reefer: Rejections for Reefer up significantly this month vs. last month.
Similar to flatbed, increased outbound volume will have a significant impact on capacity in the Reefer space.
White line – Van: Van Rejections come back down slightly vs. last month but remain up vs. this same time last year.
Rejections are forecasted to remain higher this year based on the lack of capacity in the market.
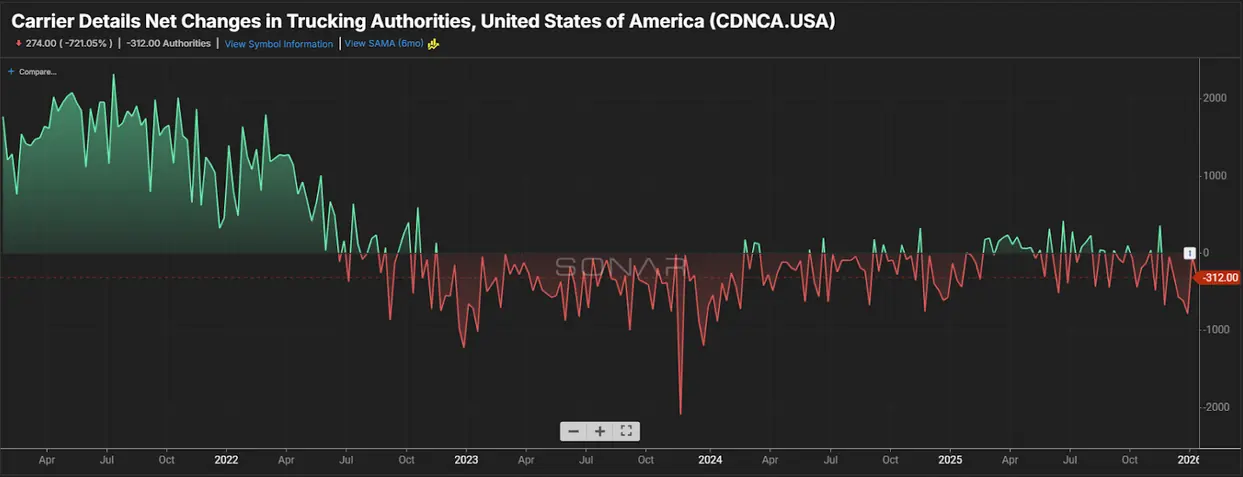
Carrier Authorities
This graph indicates we have less transportation companies coming into the market based on the current demand.
Authorities continue to drop which is causing rejections to increase despite the overall volume decrease compared to 2025.
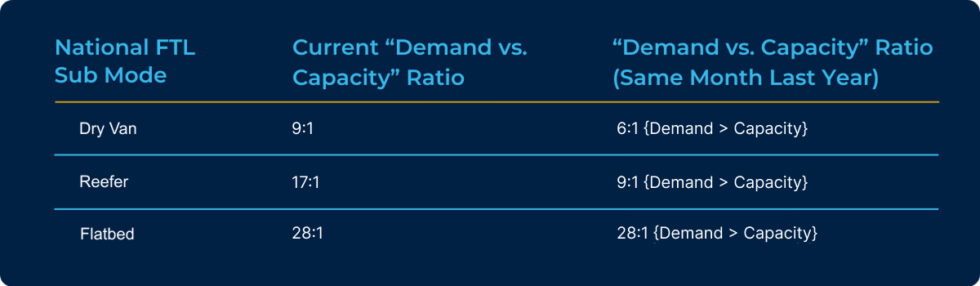
Demand vs. Capacity Metrics – October 2025
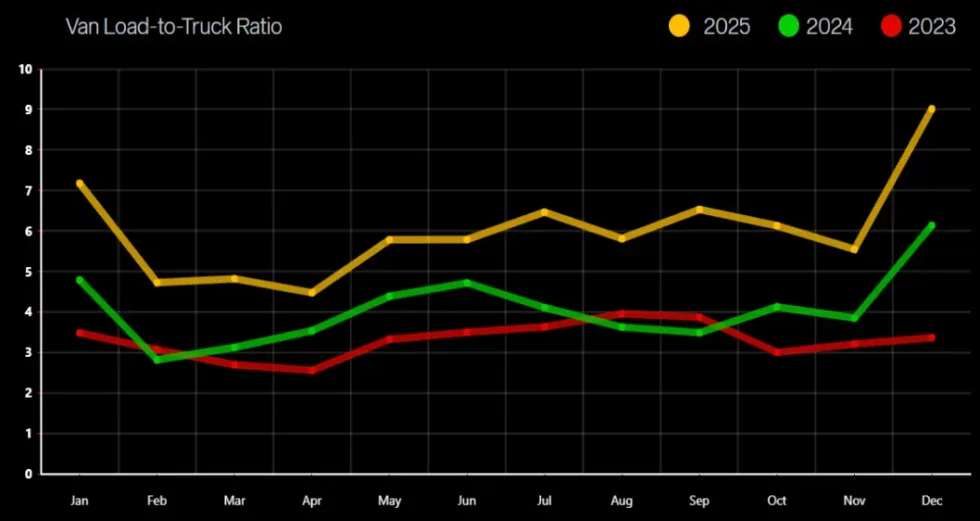
Van Load-to-Truck Ratio
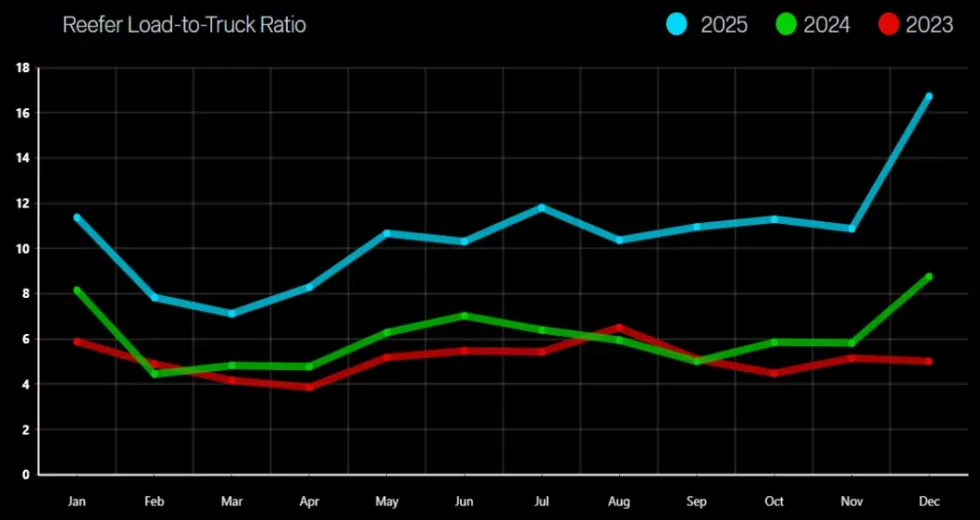
Reefer Load-to-Truck Ratio
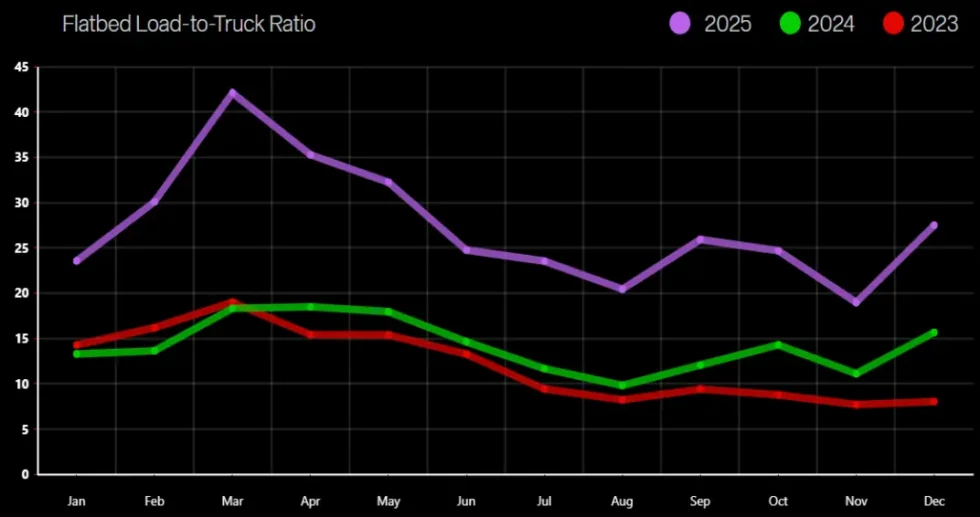
Flatbed Load-to-Truck Ratio
International
Current Market
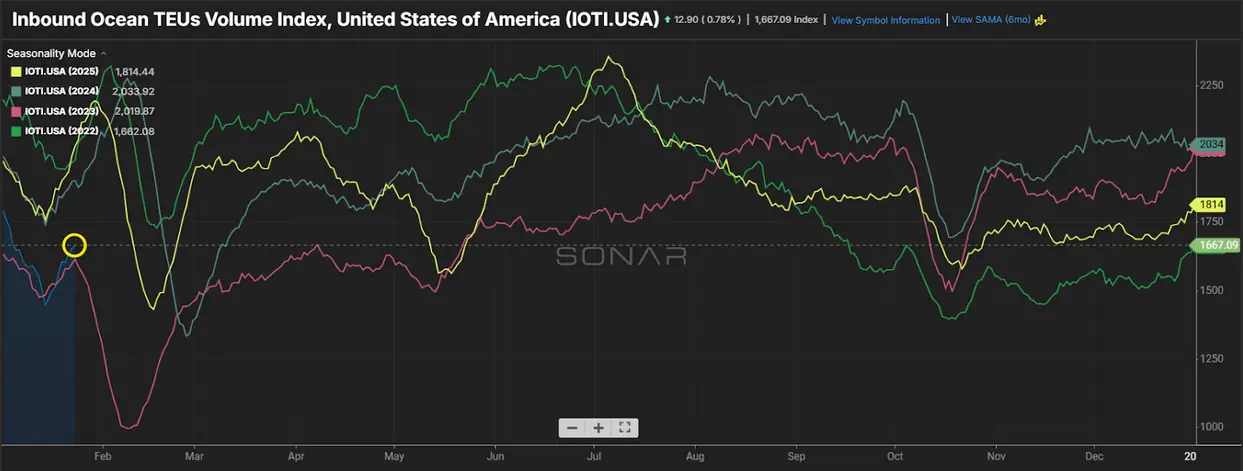
Ocean rates started high as we came into 2026 but have started to come back down.
Despite soft volumes, overcapacity still remains a long-term problem.
U.S. container imports are projected to hit 2.1M TEU’s in January of 2026.
2025 total U.S. Container imports were 0.4% lower than 2024.
Key Takeaways
Secure space early when moving ocean freight to help control the cost.
Consider mini bids to help control the volatility of the market.
Factors in tariff-driven cost that are having an impact on heavy international lanes
Cross Border
Mexican exports will remain strong in 2026.
Capacity on cross-boarder lanes continues to tighten as carriers leave the market.
Cargo theft continues to rise on U.S.-Mexico lanes.
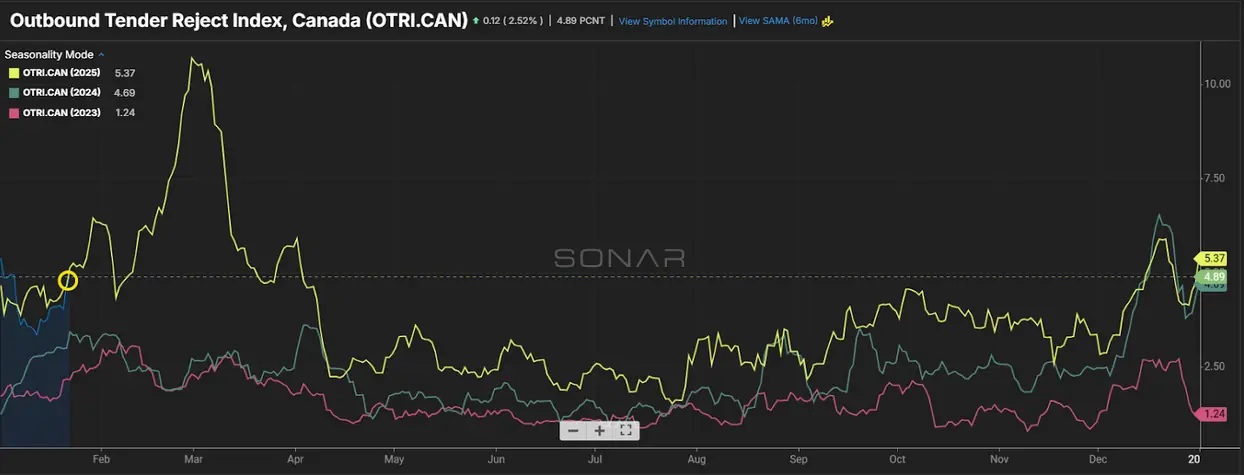
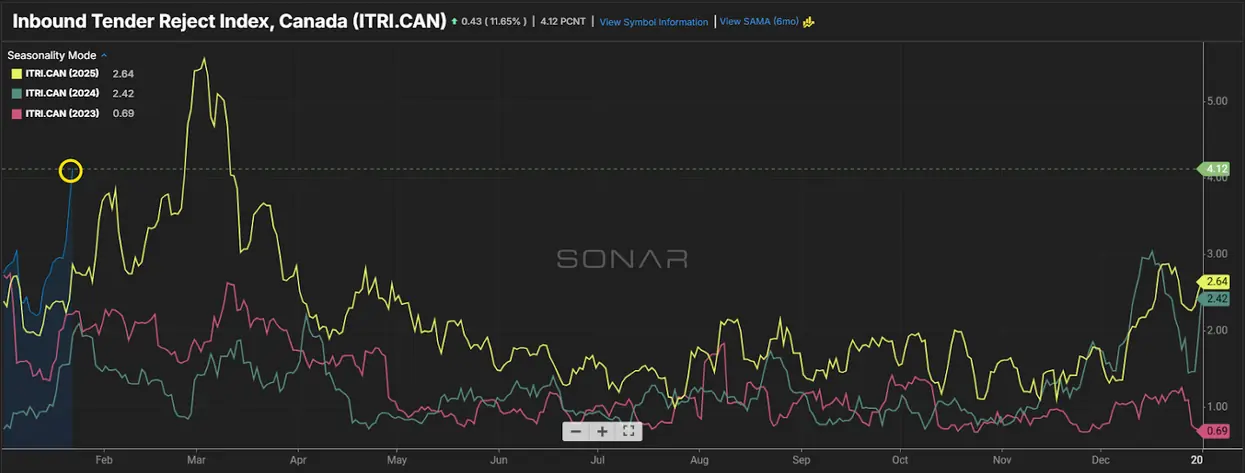
Canada imposed tariffs could have an impact on export volume into the U.S. in 2026.
Canadian rates remain stable but can increase as Canadian carrier deal with harsh winter weather.
Fuel Forecast – DOE
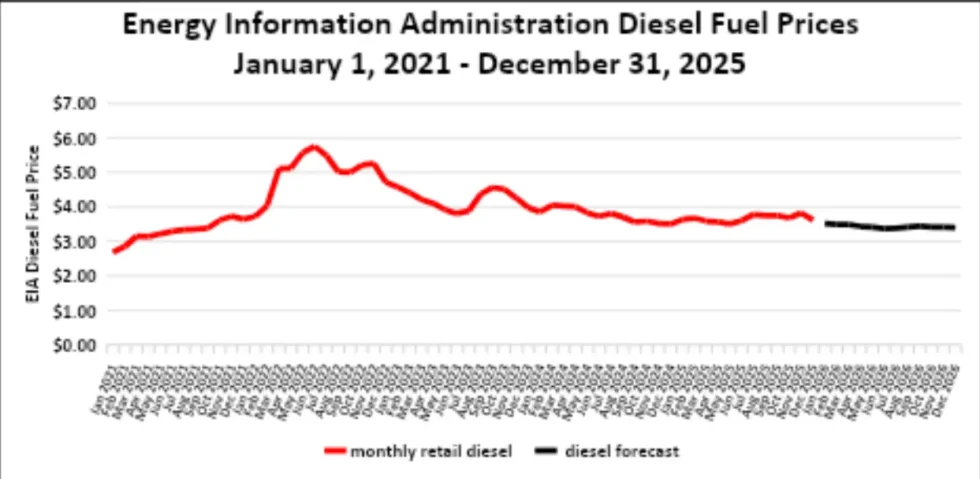
2024 diesel fuel retail prices averaged $3.761/gallon through Q4 2024 and Q1 2025 finished lower at an average $3.631/gallon, and Q2 finished at $3.555/gallon.
Fuel for Q3 finished at $3.757/gallon and Q4 finished at $3.705/gallon to close out 2025.
Energy Information Administration Diesel Fuel Prices January 1, 2021 – December 31, 2025
Talk to a team member
A brief, 15-minute meeting with a DLX shipping solutions team member, scheduled based on your availability.