This was still above the Federal Reserve’s target rate of 2%.
Spending per household increased by 2.2% in 2024.
Spending was up 0.7% in December 2024, compared to November 2024.
The current Unemployment rate is 4.1%
Unemployment rate remains relatively stable as we head into the New Year.
LTL
Overall LTL rates and demand remains steady as we head into 2025.
Many LTL carriers will be looking for the opportunity to improve their Operating Ratio with the freight they handle in 2025.
Roadrunner announces its first General Rate Increase (GRI) since 2021.
The 6.9% GRI became effective this month. Accessorial charges will also be impacted.
The National Motor Freight Traffic Association (NMFTA) will be rolling out density-based classification for 3PLs.
Shippers will soon have to know the weight and dimensions of all handling units.
The proposed change is expected to be issued this month and could potentially begin in May 2025.
Reminders when requesting LTL pricing.
The following shipment details are critical in order to receive accurate LTL pricing: Dimensions, Class, NMFC numbers, & weights.
Truckload
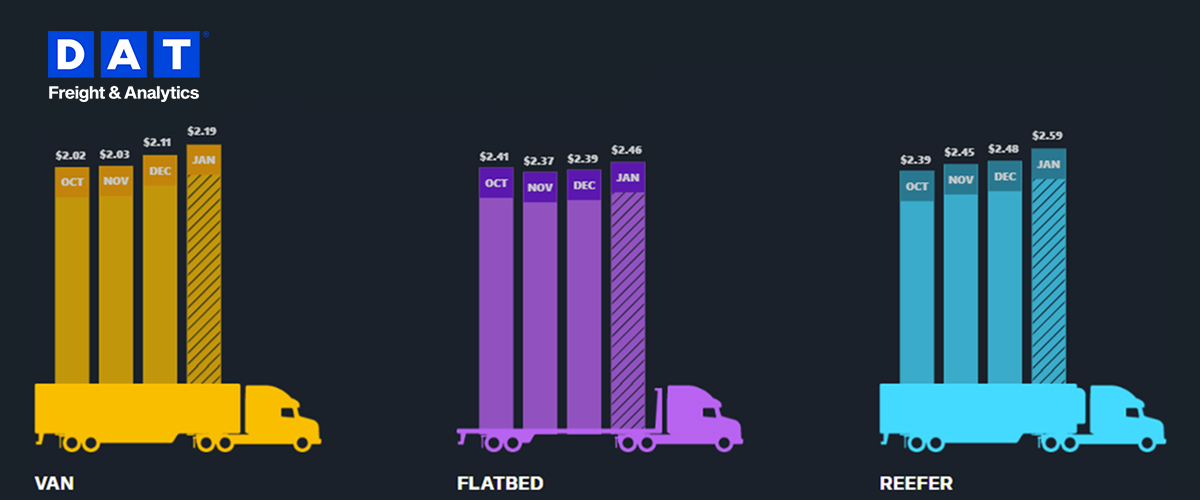
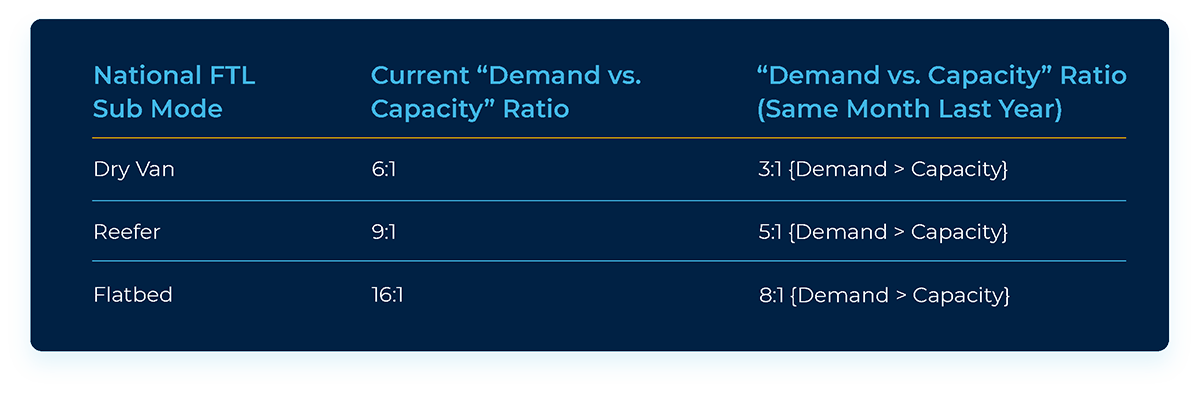
Van spot rates were up slightly (1.0%) vs. this same time last year and up slightly (0.5%) vs. last month.
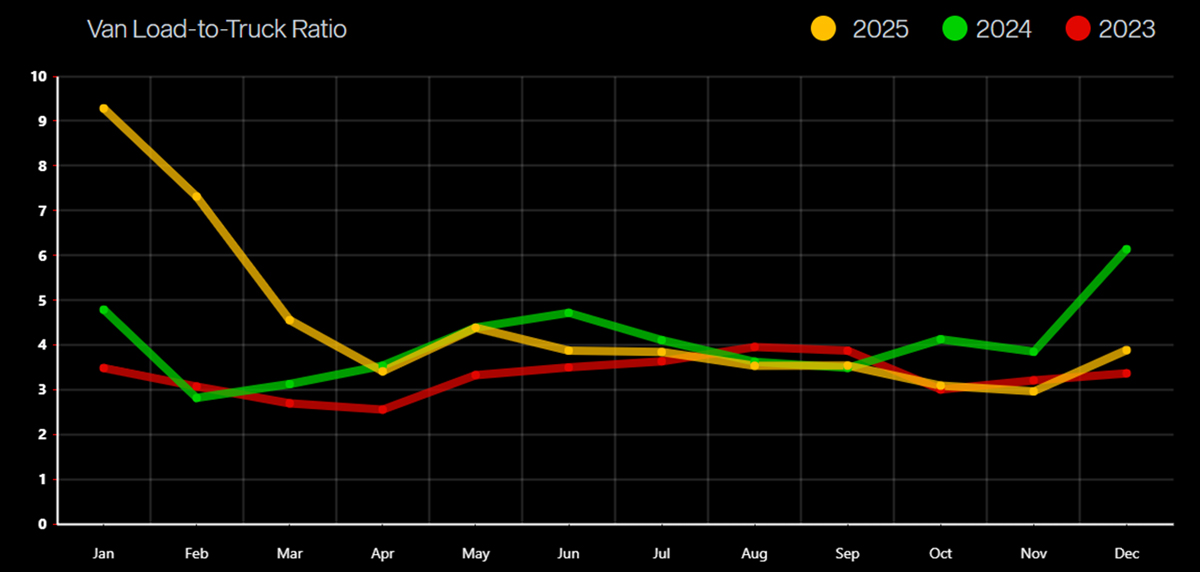
Capacity grew tighter this same time last year by 82.1% and by 59.4% vs. last Month.
January Van contracted pricing is up $.26 per mile over the spot market.
Reefer spot rates decreased (1.7%) vs. this same time last year but increased slightly (0.4%) vs. last month.
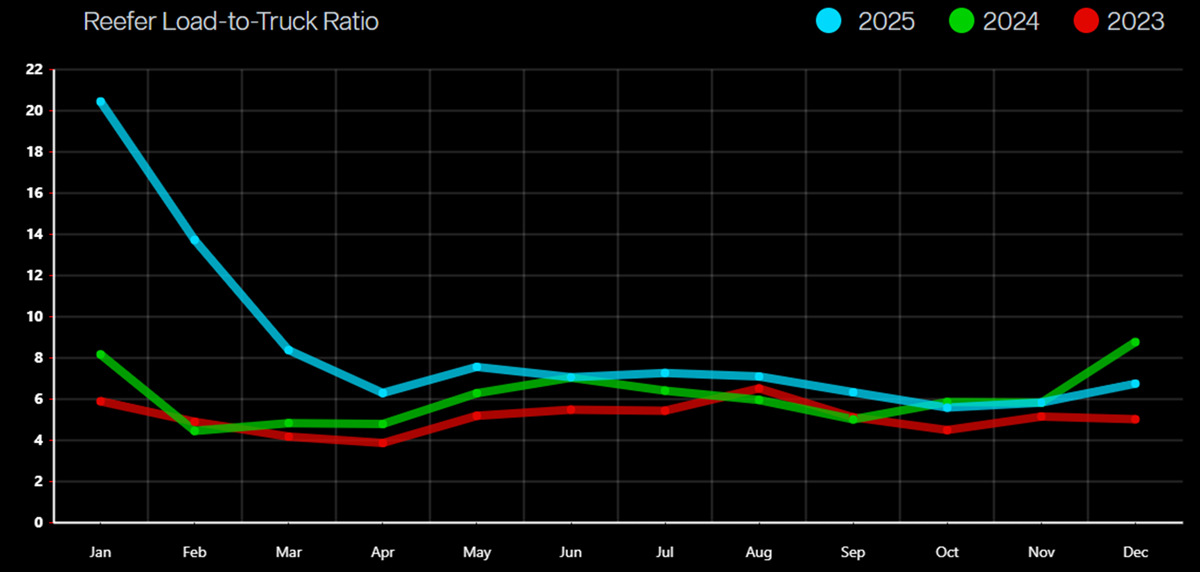
Capacity decreased by 74.8% from last year this time and decreased 50.4% vs. last month.
January Reefer contracted pricing is up $.17 per mile over spot market rates, and up $.14 per mile vs last month.
Flatbed spot rates are up (0.8%) vs. this time last year, but flat (0.0%) vs. last month.
Capacity decreased 94.6% vs. this time last year and 40.9% over last month.
January Flatbed contracted pricing is up $0.62 per mile over spot market.
Spot Market Settles Down After Recent Increases
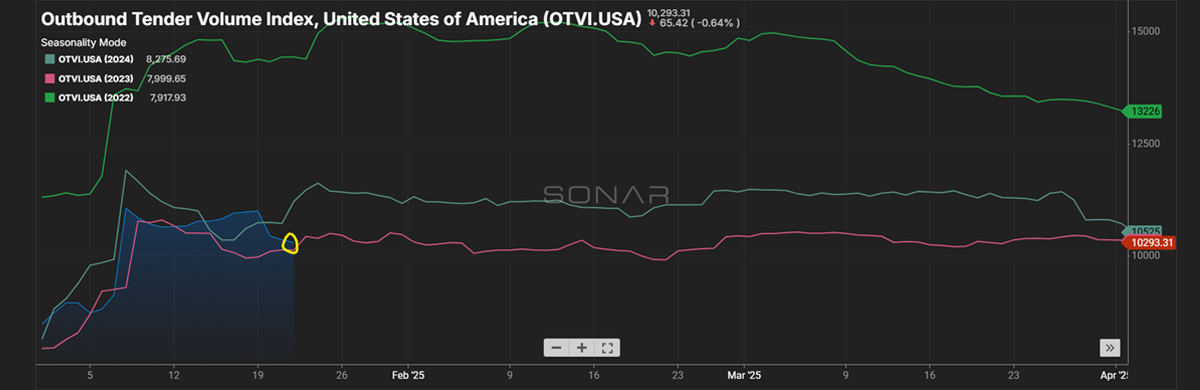
Outbound Tender Volume – All Modes
Outbound tender volume is lower than 2024 volumes, but still trending above 2023 volumes.
It’s too early to tell if this increase will hold steady or increase as we approach February.
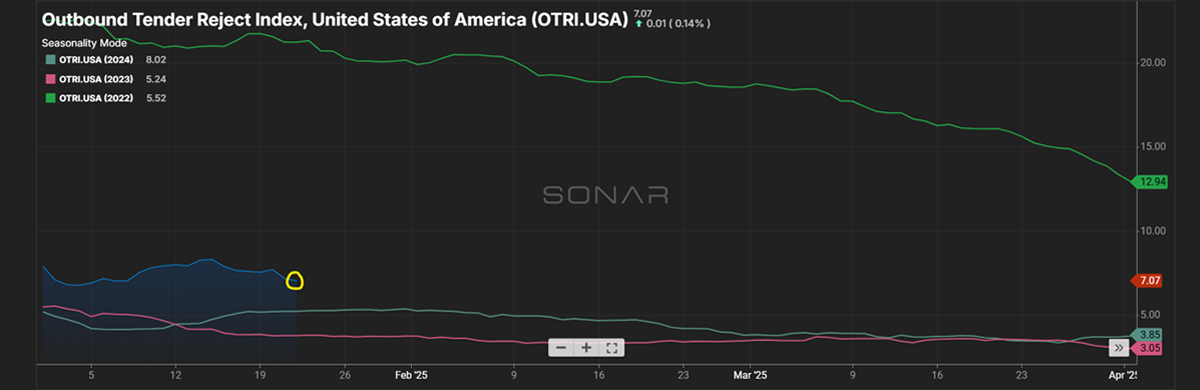
Outbound Tender Reject – All Modes
Overall Rejects continue to remain higher than 2023 and 2024.
Weather across the country has had a large impact on the overall capacity in the marketplace.
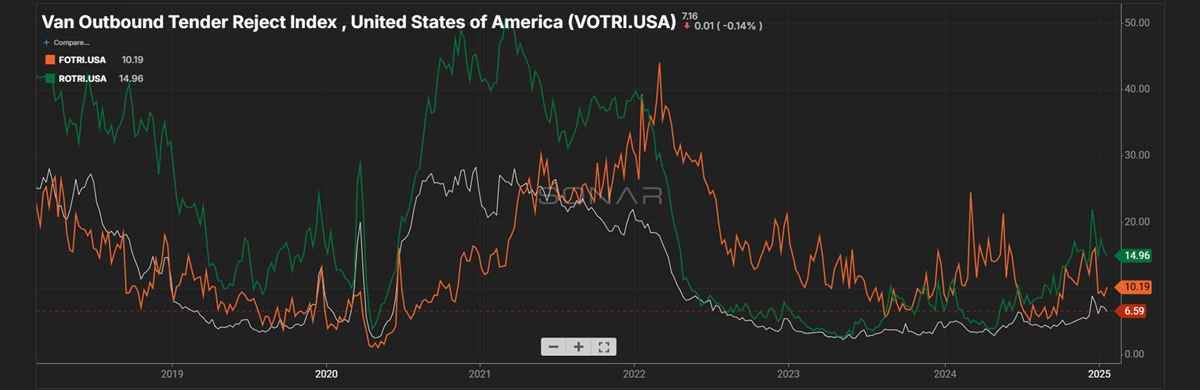
Outbound Tender Reject – by Mode
Orange Line – Flatbed: Rejections are around the same rate as what we experienced in January of 2024.
There’s been a slight spike due to weather across the country, but with overall volume down, this spike has had little impact on the market.
Green line – Reefer: Rejections for Reefer are up considerably vs this same time in 2024.
With the recent weather events across the country, we have seen an increase in rejections.
White – Van: Van Rejections are up vs. January of 2024, but still are not having a large impact on capacity and rates.
Weather has also played a large role in the uptick of rejections recently.
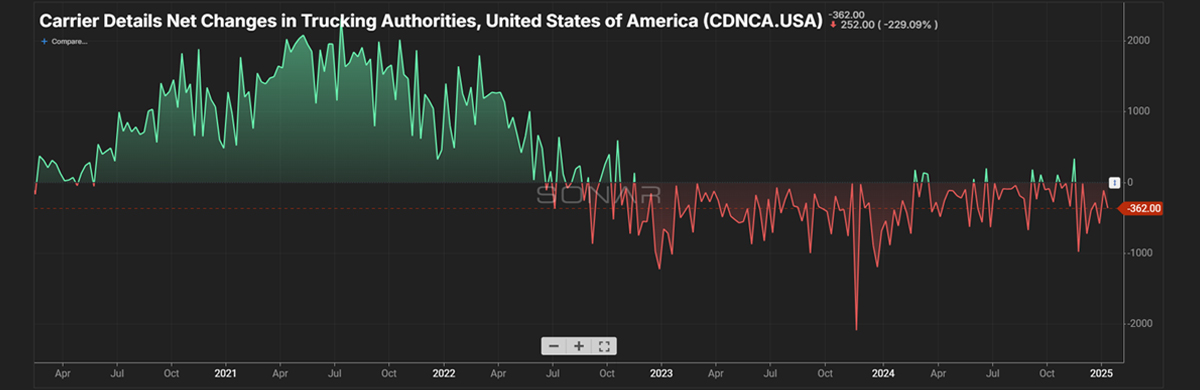
Carrier Authorities
This graph indicates we have less transportation companies entering the market based on the current demand.
We are currently still trending below the line of Authorities leaving the market.
As capacity dips, so do the number of carriers in the transportation space.
Van Load-to-Truck Ratio
Reefer Load-to-Truck Ratio
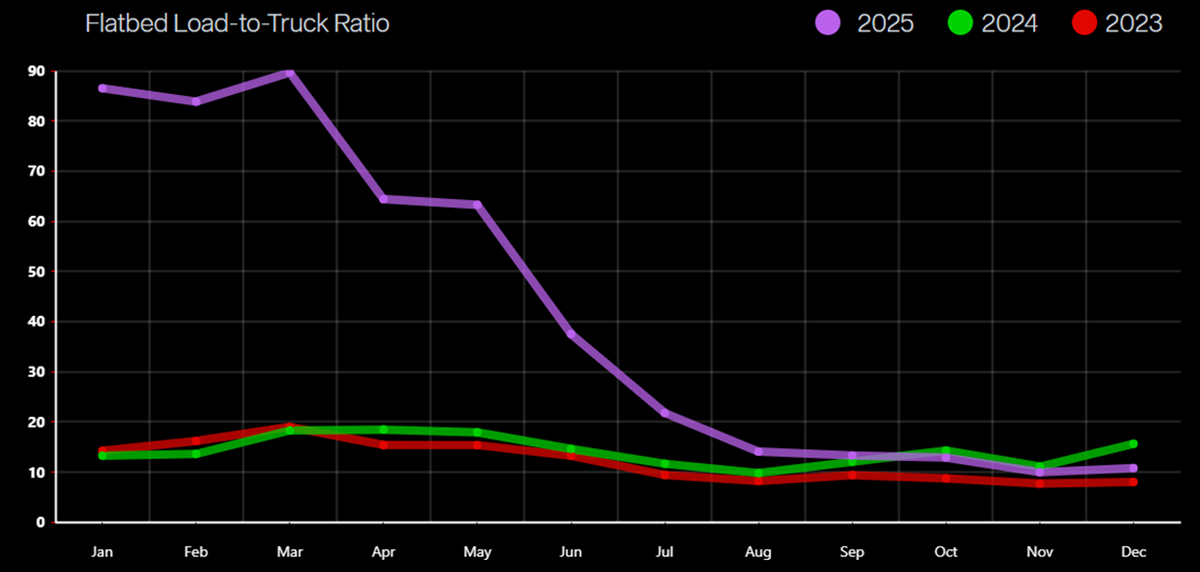
Flatbed Load-to-Truck Ratio
International
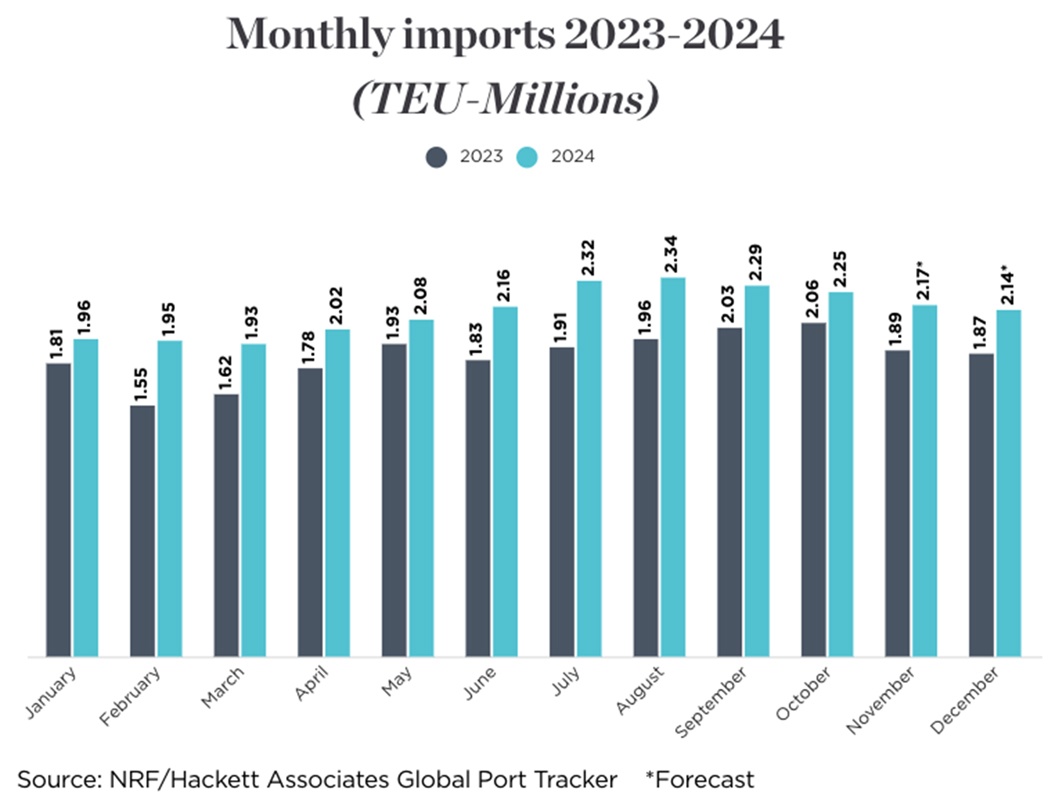
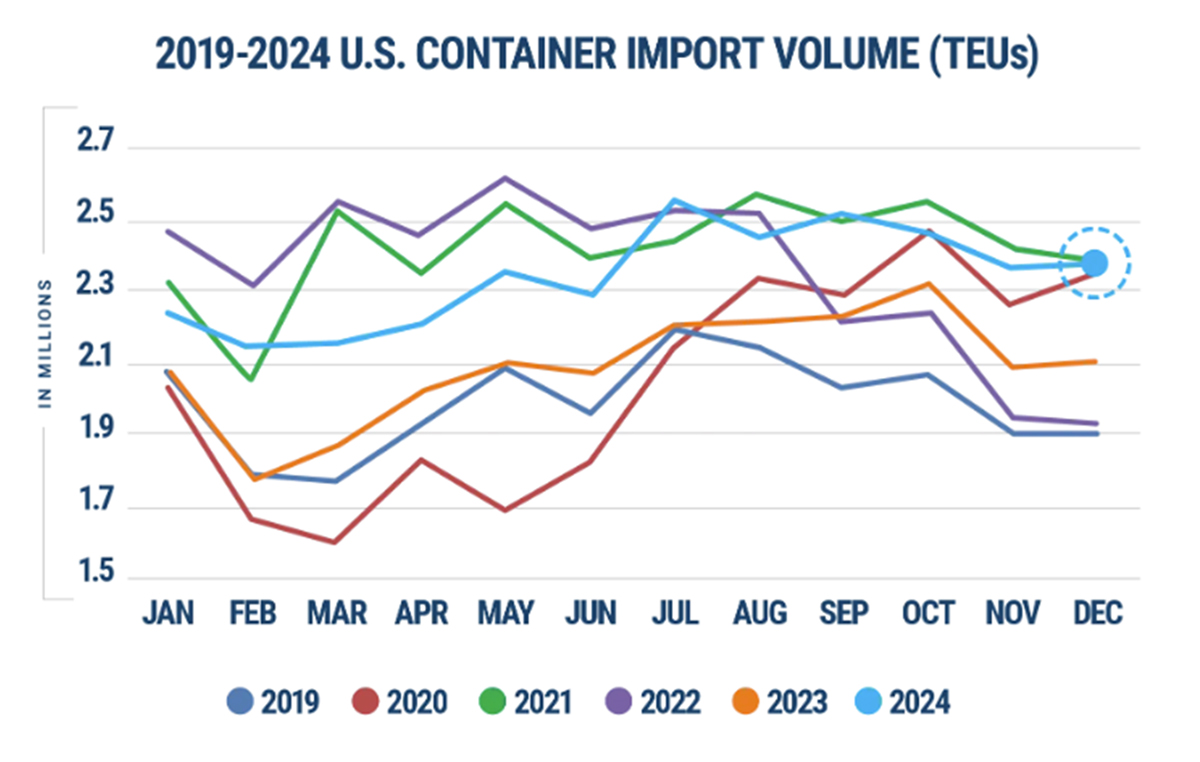
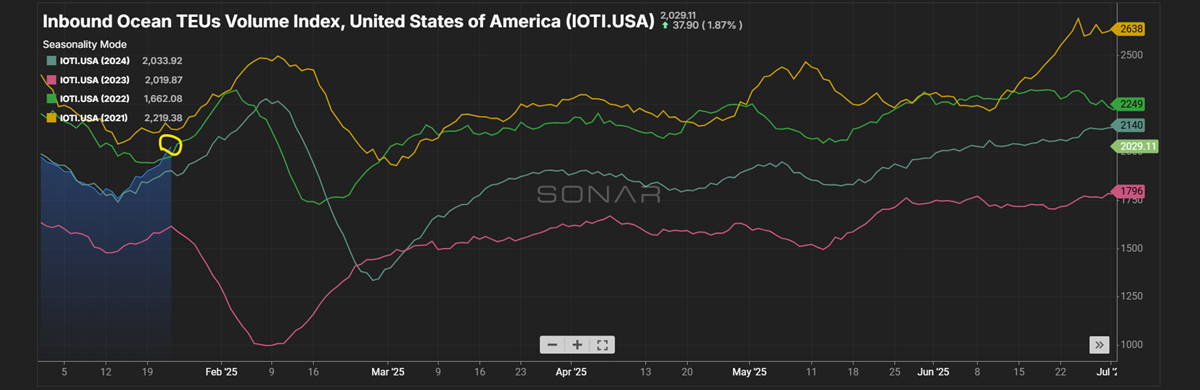
Final TEU counts have not been released, but the preliminary results show a 15.2% increase in 2024 vs. 2023.
The NRF forecasts 2.16 million TEUs in January of 2025, which would be a 10% increase over 2024.
Imports ended the year 14% higher than 2023.
Canadian News
Driver capacity remains tight as we head into 2025.
Pressure remains on inbound and outbound rates, and rates continue to rise.
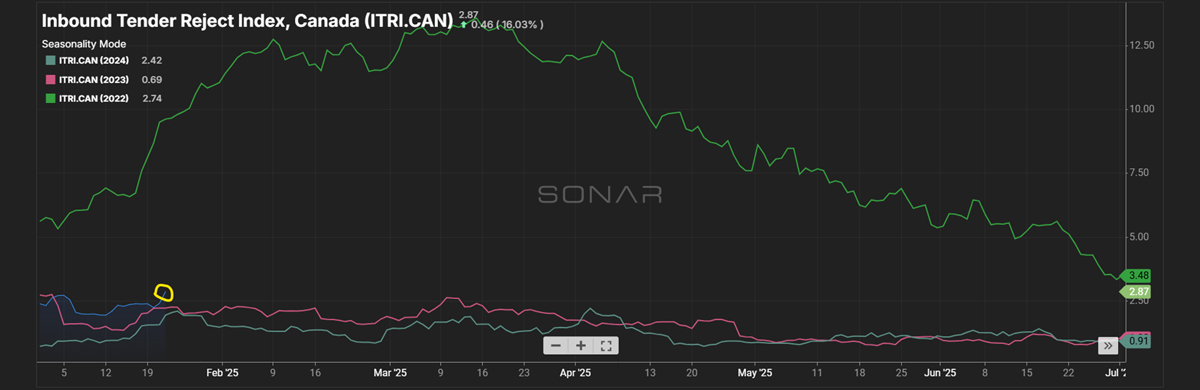
Inbound tender rejections are up compared to 2023 and 2024 levels.
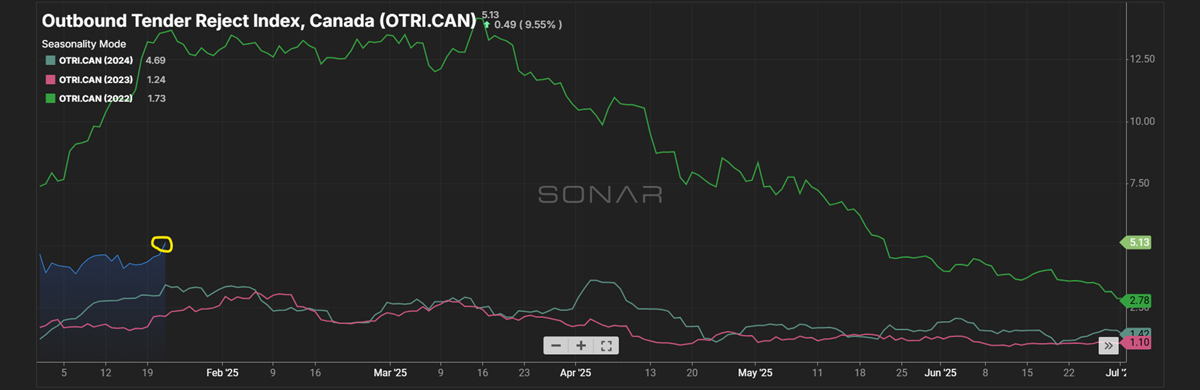
Outbound tender rejections are also up vs. 2023 and 2024 as we head into the last full week of January.
Fuel Forecast – DOE
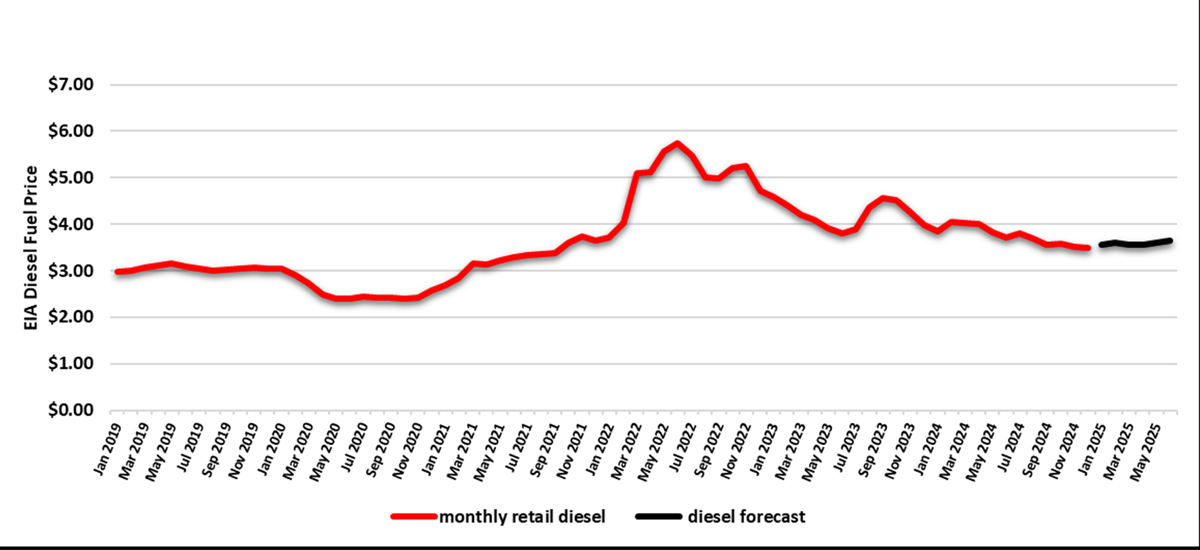
Average diesel fuel retail prices for 2024 were $3.761/gallon.
Q1 2025 is forecasted to finish at an average $3.574/gallon.
Fuel for Q2-Q4 of 2025 is forecasted to be at an average $3.694/gallon.
Energy Information Administration Diesel Fuel Prices
January 1, 2019 – December 31, 2024
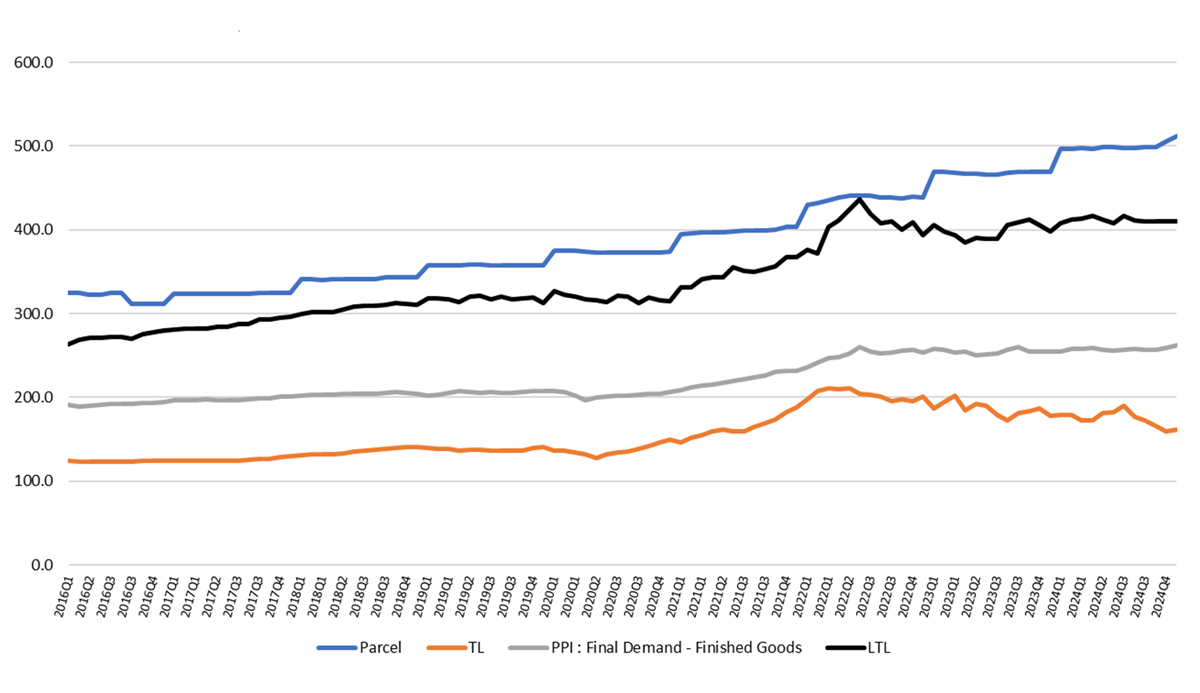
Price Index Performance: 2016-2024, By Quarter, Through December Q4 2024
State of the U.S. Transportation Market
What Does This Data Mean?
The Producer Price Index (PPI) is a family of indexes that measures the average change in selling prices received by domestic producers of goods and services over time. PPIs measure price change from the perspective of the seller. In other words, the PPI measures the trend of the cost of everything Manufactured in the United States.
Talk to a team member
A brief, 15-minute meeting with a DLX shipping solutions team member, scheduled based on your availability.