November added 227,000 jobs, however, unemployment rose to 4.2%.
Manufacturing production increased by 0.2% in November.
Manufacturing is still down 1% year-over-year
Mortgage rates on a 30-year fix fell by 18 basis points in November to 6.6%. This is still high when compared to historic levels.
LTL
FedEx Freight looks to become a separate public trading company in 18 months.
Pitt Ohio adds Sutton Transport to its network. This acquisition will add 13 terminals, 384 power units, and 455 drivers.
The National Motor Freight Traffic Association (NMFTA) will be rolling out density-based classification for 3PLs.
Shippers will soon have to know the weight and dimensions of all handling units.
The proposed change will be issued in January 2025, potentially beginning in May 2025.
Key Information for LTL shippers when requesting pricing.
Dimensions, Class, NMFC numbers, and weights are critical to getting the correct price on the front end of your shipment.
Truckload
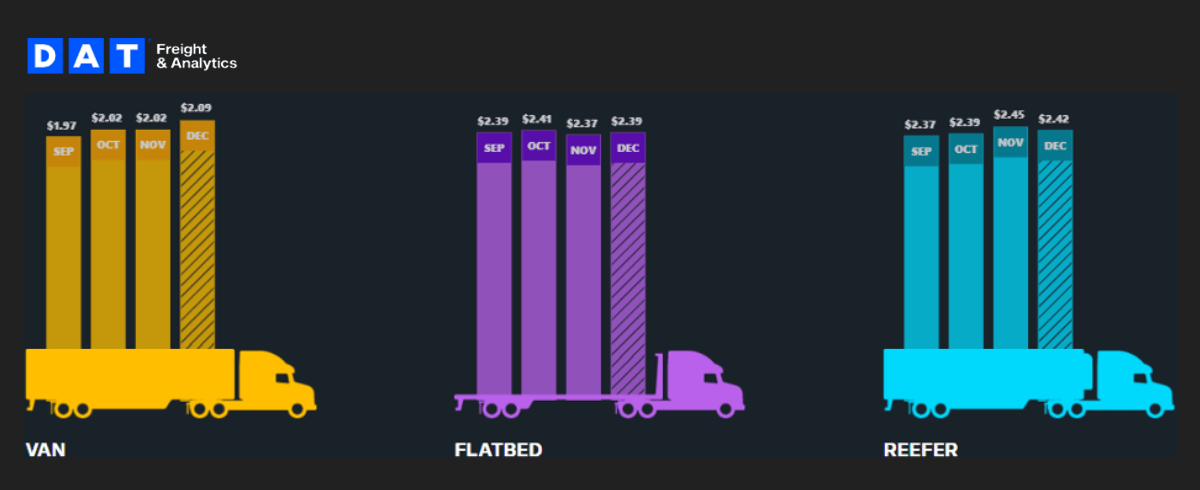
Van spot rates were slightly up 0.5% vs. this same time last year but Flat 0.0% vs. last month. Capacity grew tighter this same time last year by 19.8% but improved by 6.7% vs. last Month. December Van contracted pricing is up $.31 per mile over the spot market.
Reefer spot rates decreased by 1.7% vs. this same time last year but increased slightly by 0.4% vs. last month. Capacity decreased from last year this same time by 13.2% but improved by 0.4% vs. last month. December Reefer contracted pricing is tracking up $.31 per mile over spot market.
Flatbed spot rates are up 2.0% vs. this same time last year and up 0.8% vs. last month. Capacity decreased by 44.1% vs. this same time last year but improved by 22.3% over last month. December Flatbed contracted pricing is tracking up $0.68 per mile over spot market.
Spot market ending 2024 on a higher note
Outbound Tender Volume – All Modes
Outbound volume is trending down vs. what we saw in 2023. This is a typical volume drop based on historical trends.
Outbound Tender Reject – All Modes
Overall Rejects continue to remain higher than 2023/2022. As we move into 2025, capacity can always tighten up in the winter months.
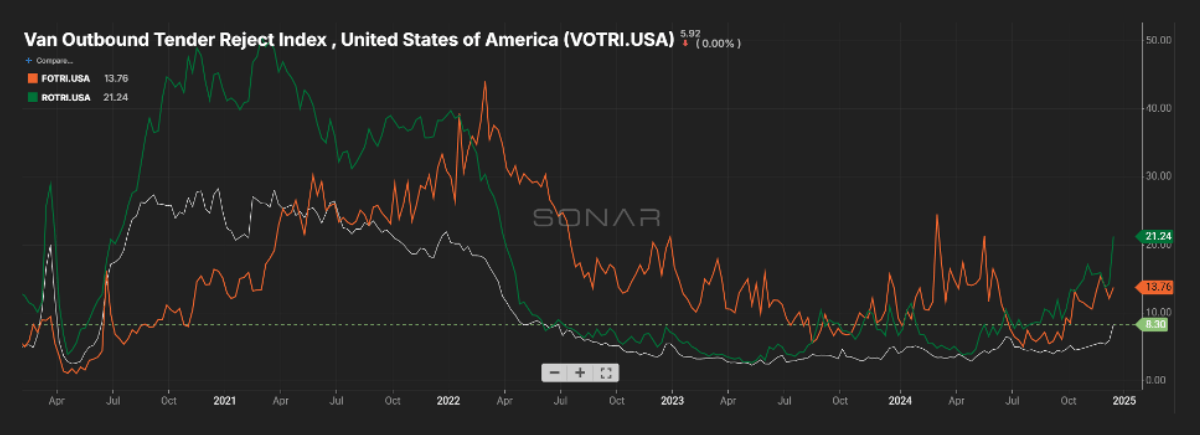
Outbound Tender Reject – by Mode
Orange Line – Flatbed: Rejections still trending down vs. what we saw in the beginning of 2024. We will need to keep a close eye on this as the market turns and the weather changes.
Green Line – Reefer: Rejections are still up over what we saw at the beginning of the year. Rejections will only go up as we head into the winter months. More shippers will be looking for temperature-controlled units to help their products from being affected by the cold temperatures.
White Line – Van: Van Rejections have jumped slightly as we head towards the end of December. Like the other modes, the capacity can be impacted by the weather in the winter months.
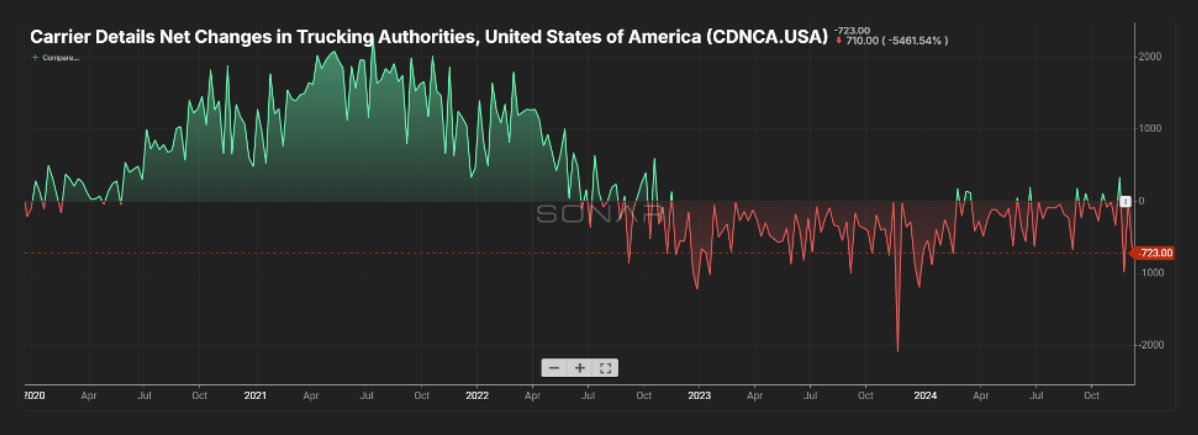
Carrier Authorities
This graph indicates we have fewer transportation companies coming into the market based on the current demand.
Carrier Authorities have gone up and down by remaining below the line. As the market increases its overall outbound volume, you will see this start to trend up.
Van Load-to-Truck Ratio
Reefer Load-to-Truck Ratio
Flatbed Load-to-Truck Ratio
International
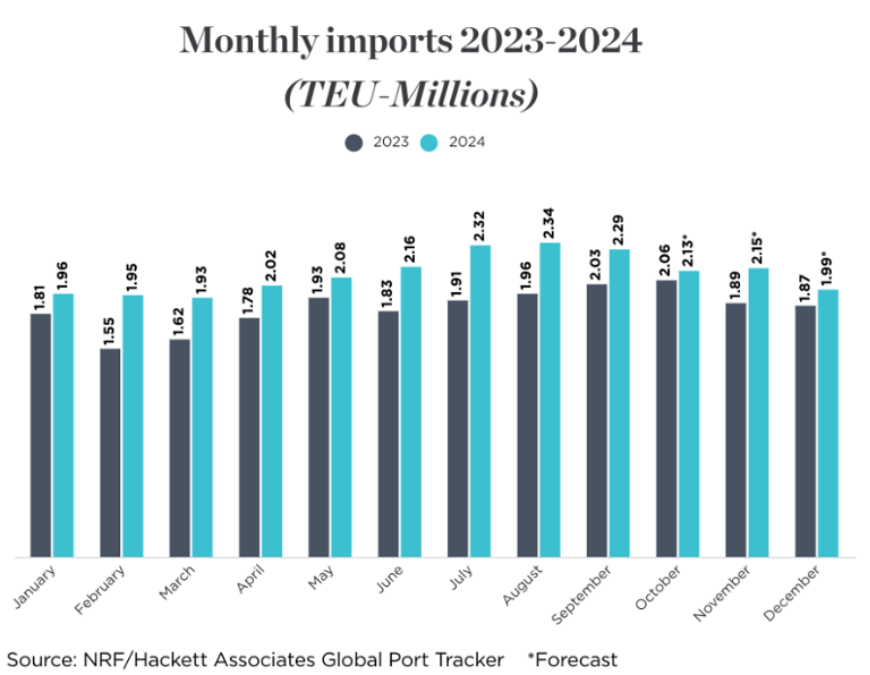
Inbound TEU volume climbed back up as we head into the last few weeks of the year.
Record volumes at the U.S. West Coast ports, November volumes were 15% higher year-over-year.
Capacity increases by 8% in 2025 and 6% in 2026 may pressure rates.
ILA port strike is put on hold until January 15.
Canadian News
Canadian freight market remains highly favorable to shippers.
Inbound freight is surging with demand as well as rates are down, leading to an increase on the outbound rate side.
Winter weather could lead to likely distribution in the upcoming months, which could cause re-routed shipments.
Spot market rates increased slightly in November.
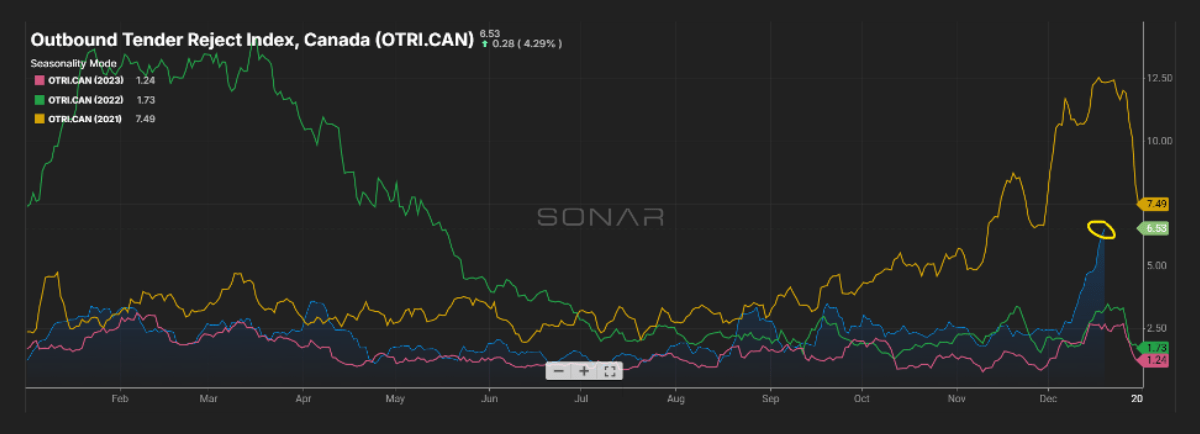
Tender rejects up over 2023 and 2022 for both outbound and inbound freight.
Fuel Forecast – DOE
Average diesel fuel retail prices for 2023 averaged at $4.214/gallon through Q4 2023 and Q1 2024 fuel finished at an average of $3.973/gallon. Fuel for Q2 finished at $3.849/gallon and Q3 averaged $3.689/gallon. Q4 is forecasted to come in around $3.549/gallon.
Energy Information Administration Diesel Fuel Prices January 1, 2019 – November 30, 2024
Price Index Performance: 2016-2024, By Quarter, Through November Q4 2024
State of the U.S. Transportation Market
What Does This Data Mean?
The Producer Price Index (PPI) is a family of indexes that measures the average change in selling prices received by domestic producers of goods and services over time. PPIs measure price change from the perspective of the seller. In other words, the PPI measures the trend of the cost of everything Manufactured in the United States.
Talk to a team member
A brief, 15-minute meeting with a DLX shipping solutions team member, scheduled based on your availability.