U.S. – China trade ceasefire pushed out 90 days; Many key issues still remain unresolved.
Freight market showing signs of stability over the next 30 days, barring any disruptions (storms, tariffs, and demand shifts).
The Middle East tension has pushed some concerns around oil volatility in the market.
Labor market decreases in July with only 114k jobs added after the 147k jobs in June; unemployment is down to 4.3%.
30-year fixed mortgage is sitting at 6.58%.
LTL
Several LTL carriers reported on Q2 earnings in July and August.
Most carriers have missed expectations this quarter but continue to stay on the course hoping for a market shift in Q3 and Q4.
The National Motor Freight Traffic Association (NMFTA) density-based classification for 3PLs began on July 19.
FedEx Freight extended new class rule changes to December 1.
Key Information for LTL shippers when requesting pricing.
Dimensions, Class, NMFC numbers, and weights are critical to obtain correct pricing on the front end of your shipment.
Truckload
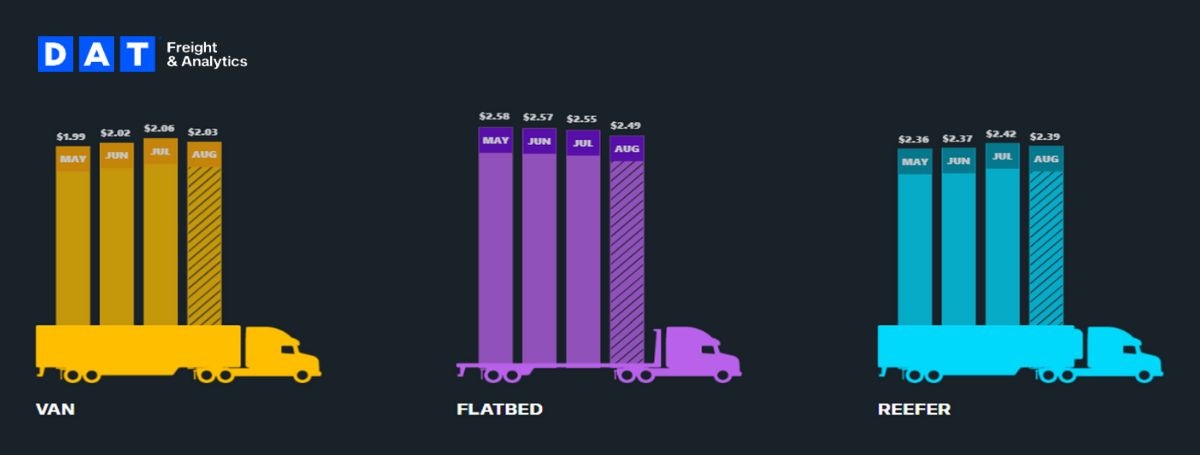
Van spot rates were flat (0.0%) vs. this same time last year but down slightly (0.5%) vs. last month.
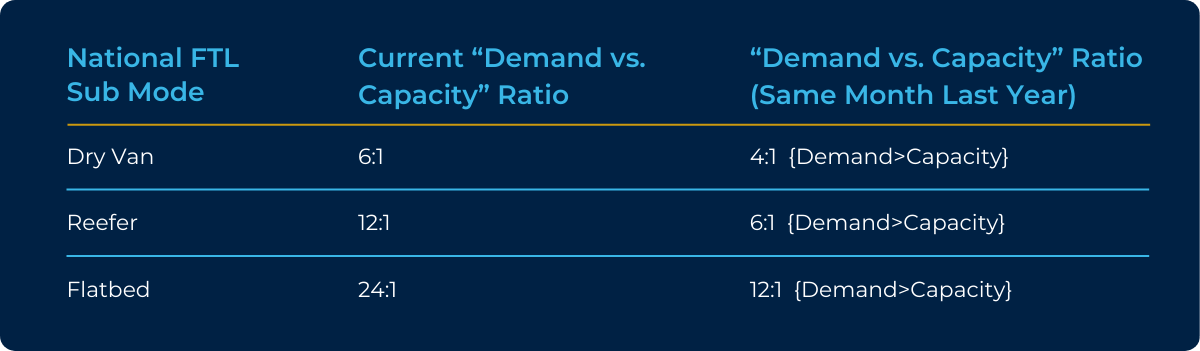
Capacity grew tighter by 57.3% compared to last year and 11.7% compared to last month.
August Van contracted pricing is up $.39 per mile over the spot market.
Reefer spot rates decreased (0.4%) vs. last year but up (1.3%) vs. last month.
Capacity grew tighter by 84.3% vs. last year and 14.5% vs. last month.
August Reefer contracted pricing is tracking up $.38 per mile over the spot market.
Flatbed spot rates were down (0.4%) vs. last year and (0.8%) vs. last month.
Capacity grew tighter by 101.4% vs. last year but improved by 4.9% over last month.
August Flatbed contracted pricing is tracking up $0.58 per mile over the spot market.
Outbound Tender Volume – All Modes
Outbound tender volume climbed up slightly this month but is still trending below 2023 and 2024 volumes.
Outbound Tender Reject – All Modes
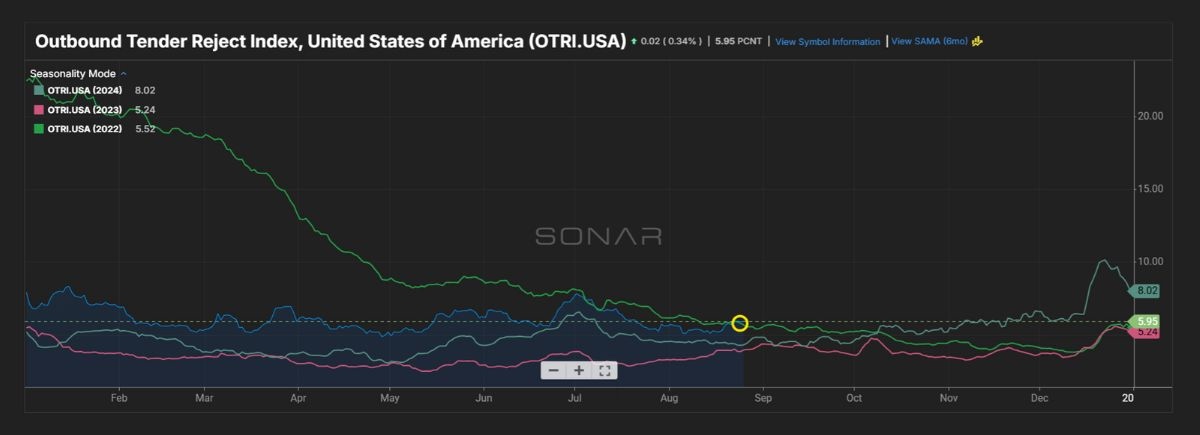
Overall Rejects continue to remain higher than 2023 and 2024.
Capacity still reflects a tighter market over 2024, but the overall freight demand is still low.
Outbound Tender Reject – by Mode
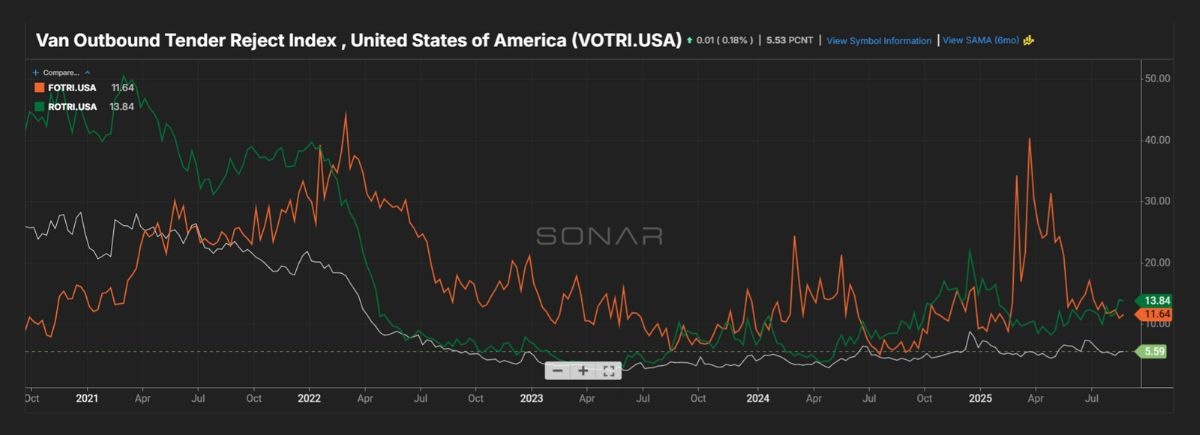
Orange Line – Flatbed: Rejections are up vs. this same time last year.
Rejections fluctuated based on the unknowns the market is facing.
Green line – Reefer: Rejections are improving, but still higher than this time last year.
Keep a close eye on your carrier capacity as we creep closer to the Holiday season.
White line – Van: Rejections remain up slightly vs. 2024 but are not having a large impact on capacity and rates.
Rejections continue to fluctuate month over month, but still remain flat since the start of this year.
Carrier Authorities
This graph indicates we have less transportation companies coming into the market based on the current demand.
Authorities climbed slightly this month and are up vs. 2024, even with a market that has less outbound freight.
Van Load-to-Truck Ratio
Reefer Load-to-Truck Ratio
Flatbed Load-to-Truck Ratio
International
The Port of LA had a record July (all time high).
Spot container rates from China to the West Coast are down since May; now lowest since late 2023.
Shippers should look to add lead time to loads moving international to avoid overpaying with temporary spikes.
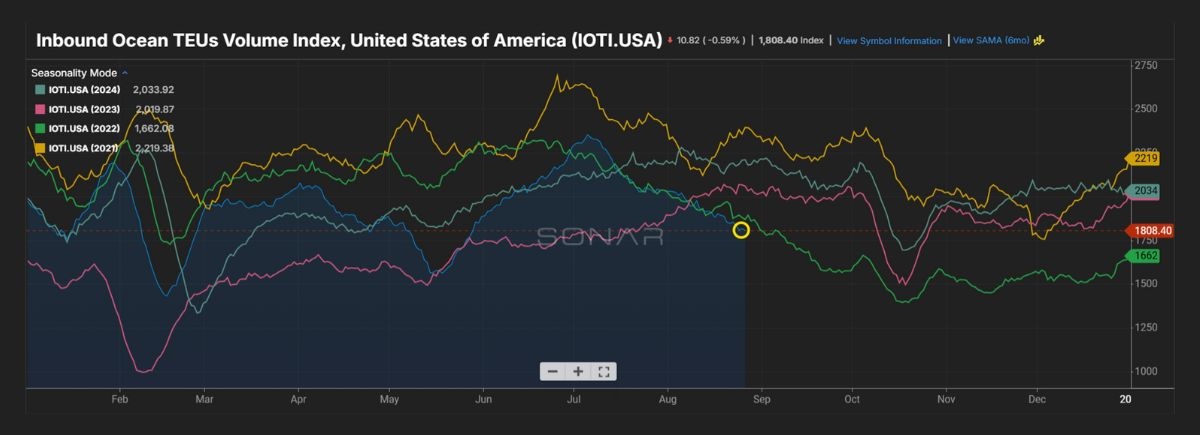
S. container import volume increased in July over June. August is showing a decline as we head into the last week.
Canadian News
Outbound tender rejects increase as we head into the end of August. Rejections are still low vs. historical trends, but something to keep an eye on.
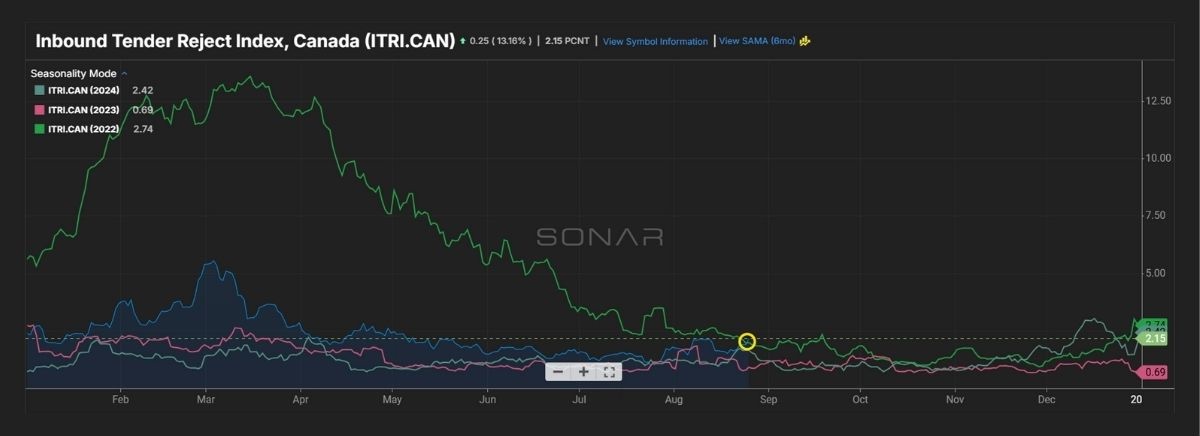
Inbound tender rejections were up in August over July.
Truck orders jumped up in June over May.
Spot rates also jumped slightly (1.7%) vs. May.
Spot Market Insights
Fuel Forecast – DOE
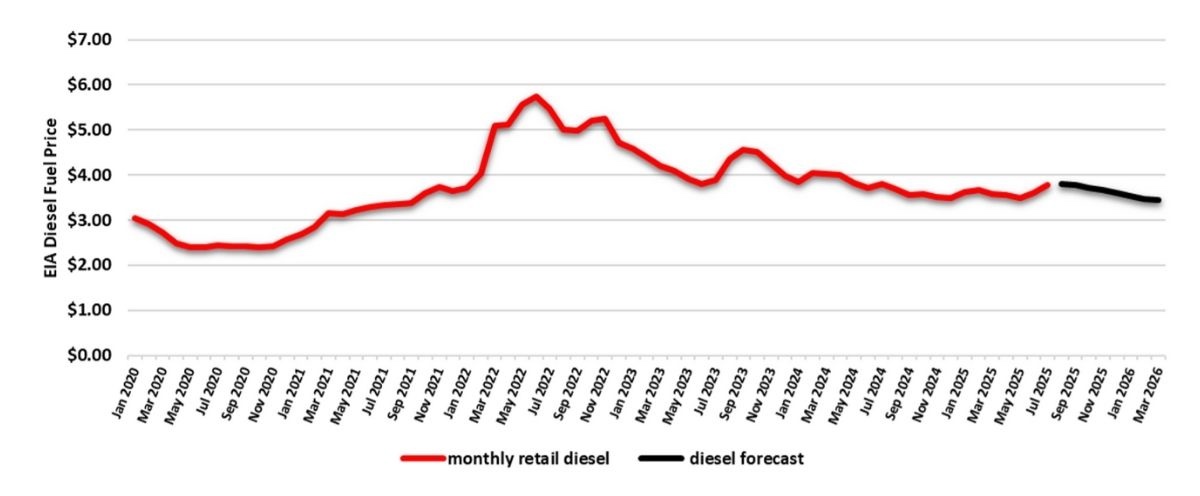
2024 diesel fuel retail prices averaged $3.761/gallon through Q4 2024. Q1 2025 finished lower at an average of $3.631/gallon and Q2 finished at $3.555/gallon.
Fuel for Q3-Q4 of 2025 is forecasted at an average of $3.722/gallon.
Energy Information Administration Diesel Fuel Prices January 1, 2020 – July 31, 2025
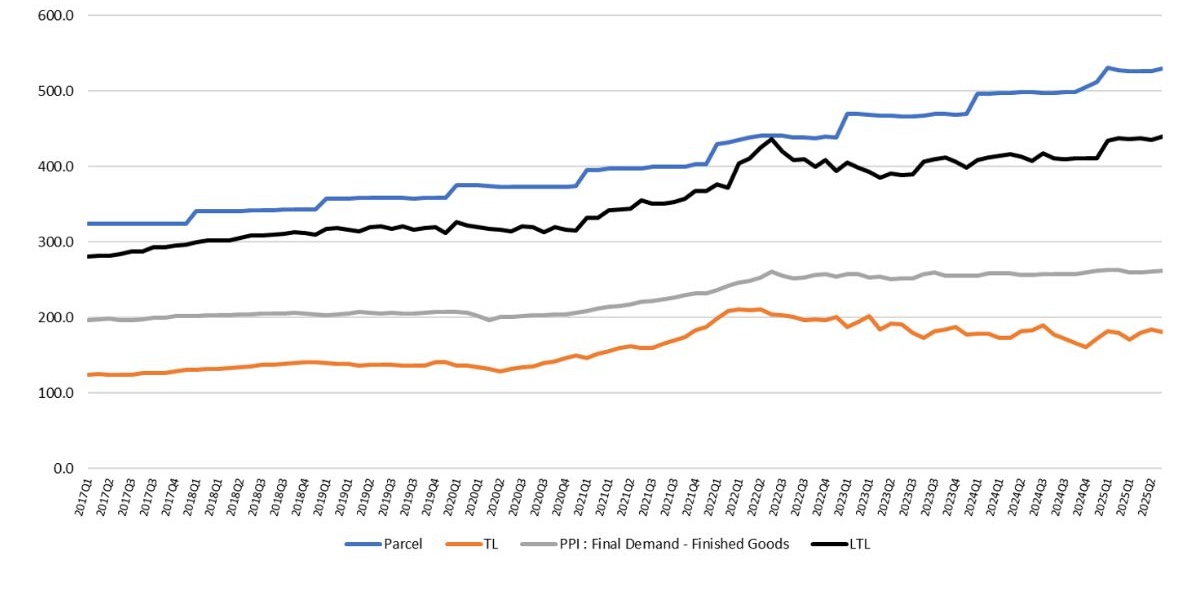
Price Index Performance: 2017 -2025, By Quarter, Through July Q3 2025
State of the U.S. Transportation Market
What Does This Data Mean?
The Producer Price Index (PPI) is a family of indexes that measures the average change in selling prices received by domestic producers of goods and services over time. PPIs measure price change from the perspective of the seller. In other words, the PPI measures the trend of the cost of everything Manufactured in the United States.
Talk to a team member
A brief, 15-minute meeting with a DLX shipping solutions team member, scheduled based on your availability.