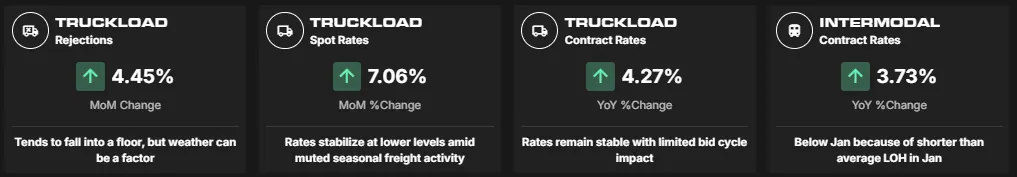
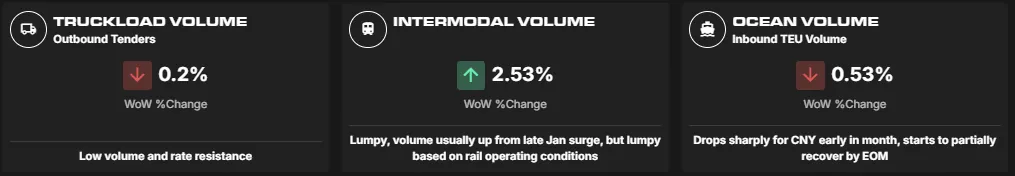
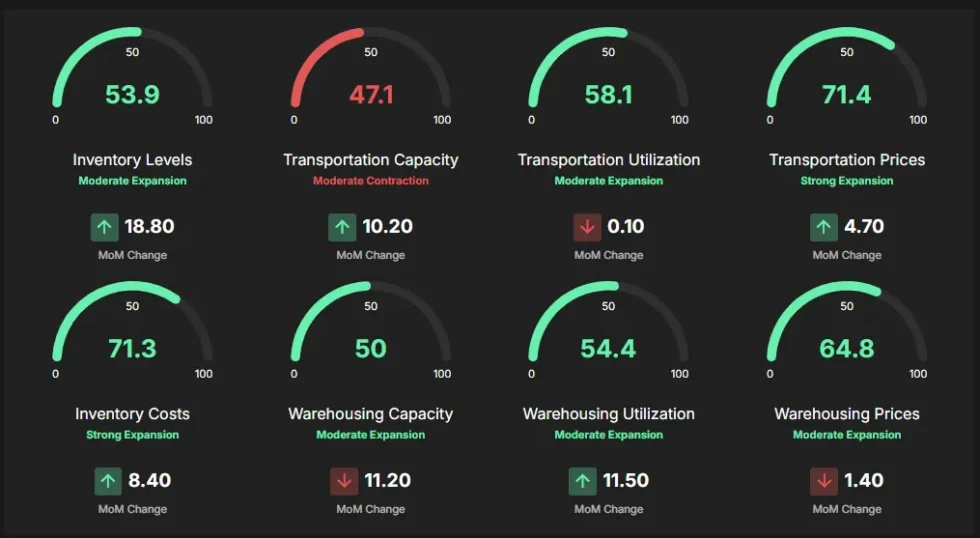
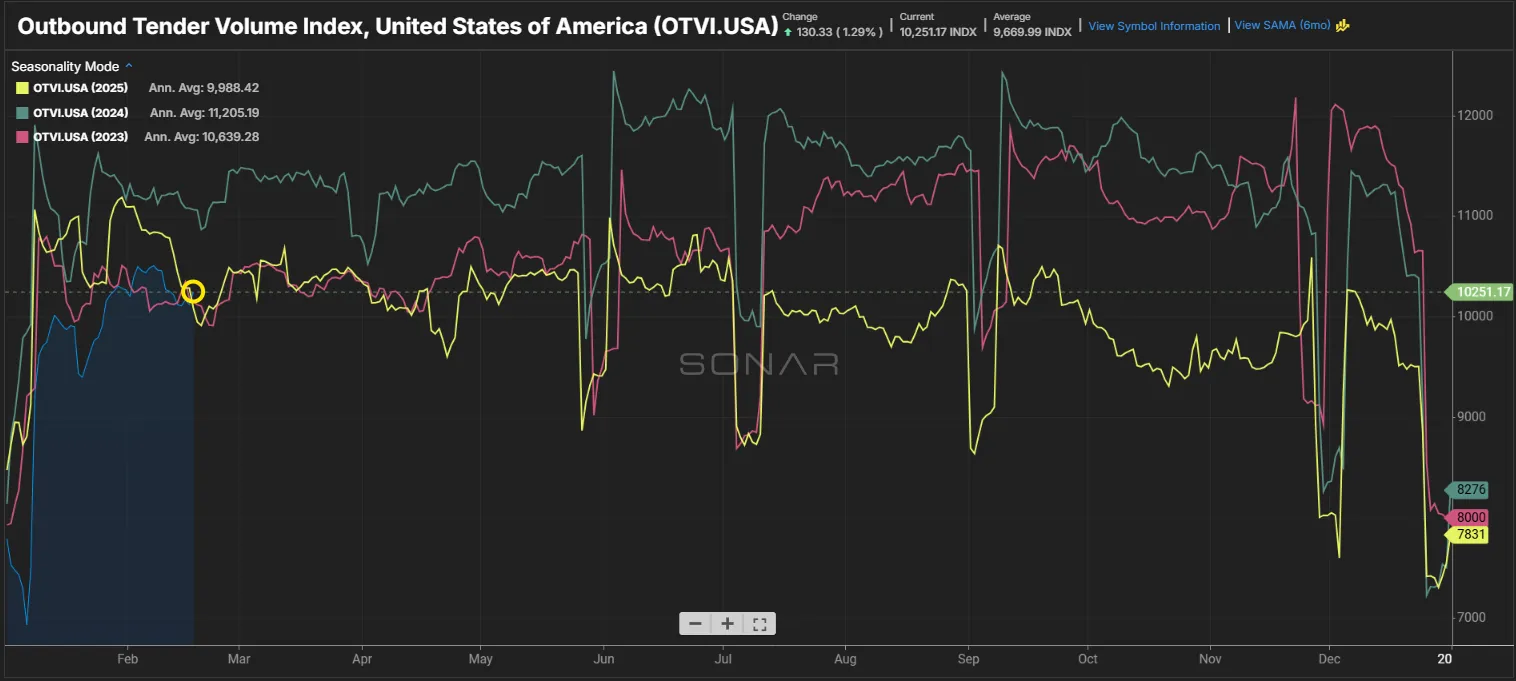
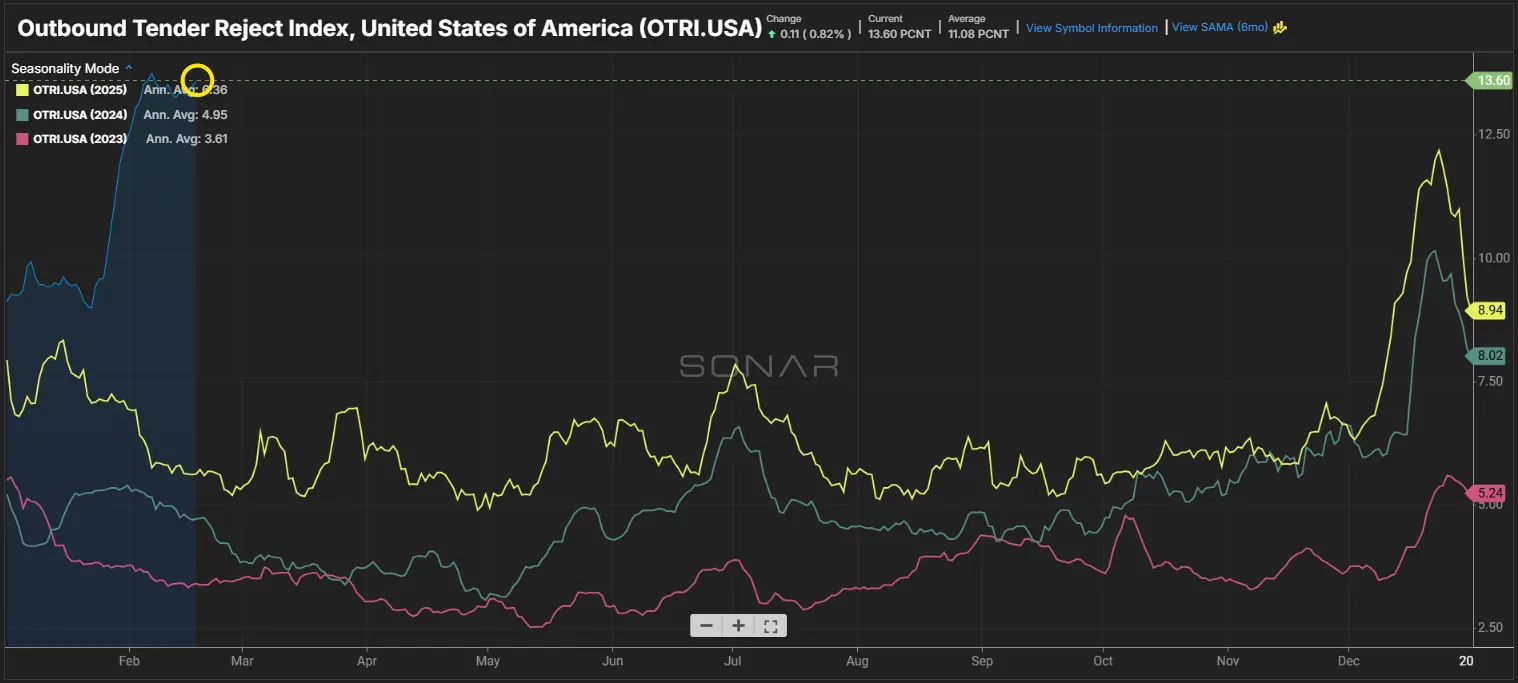
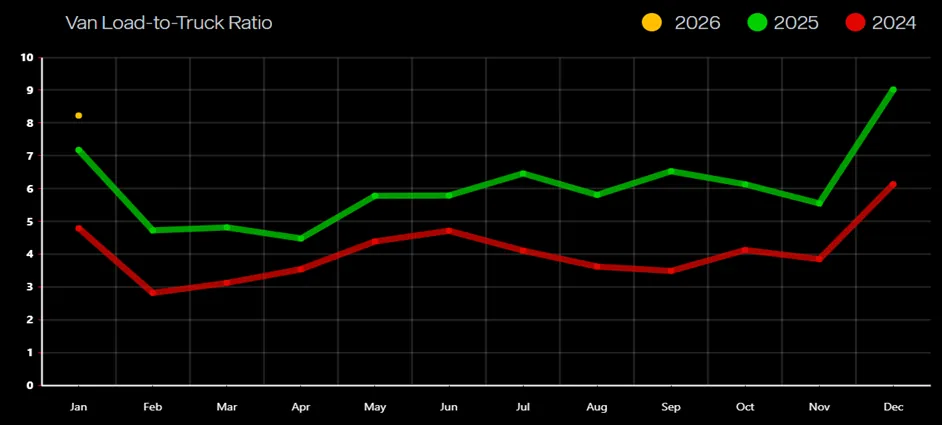
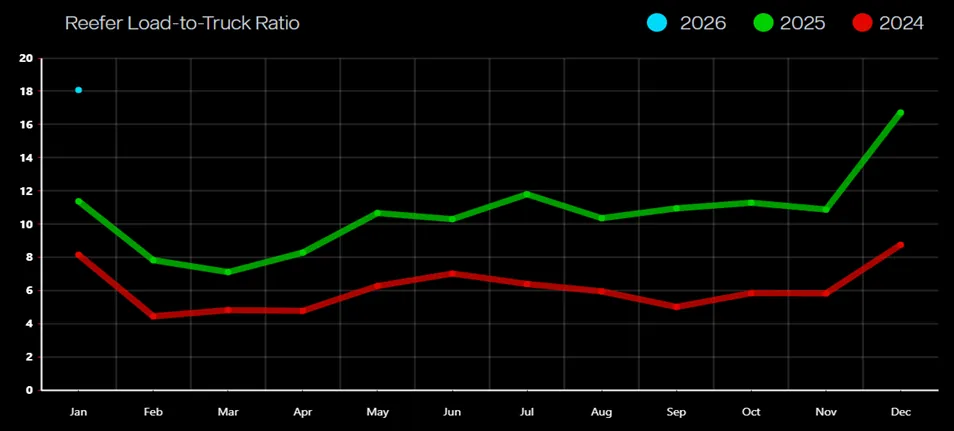
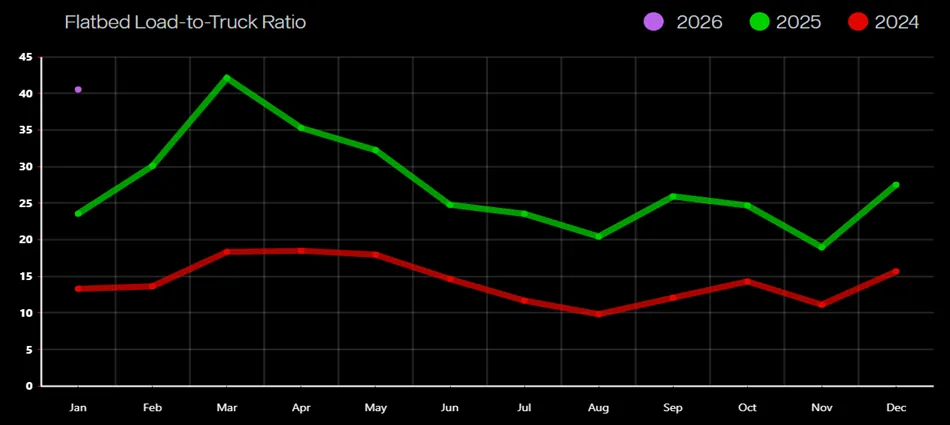
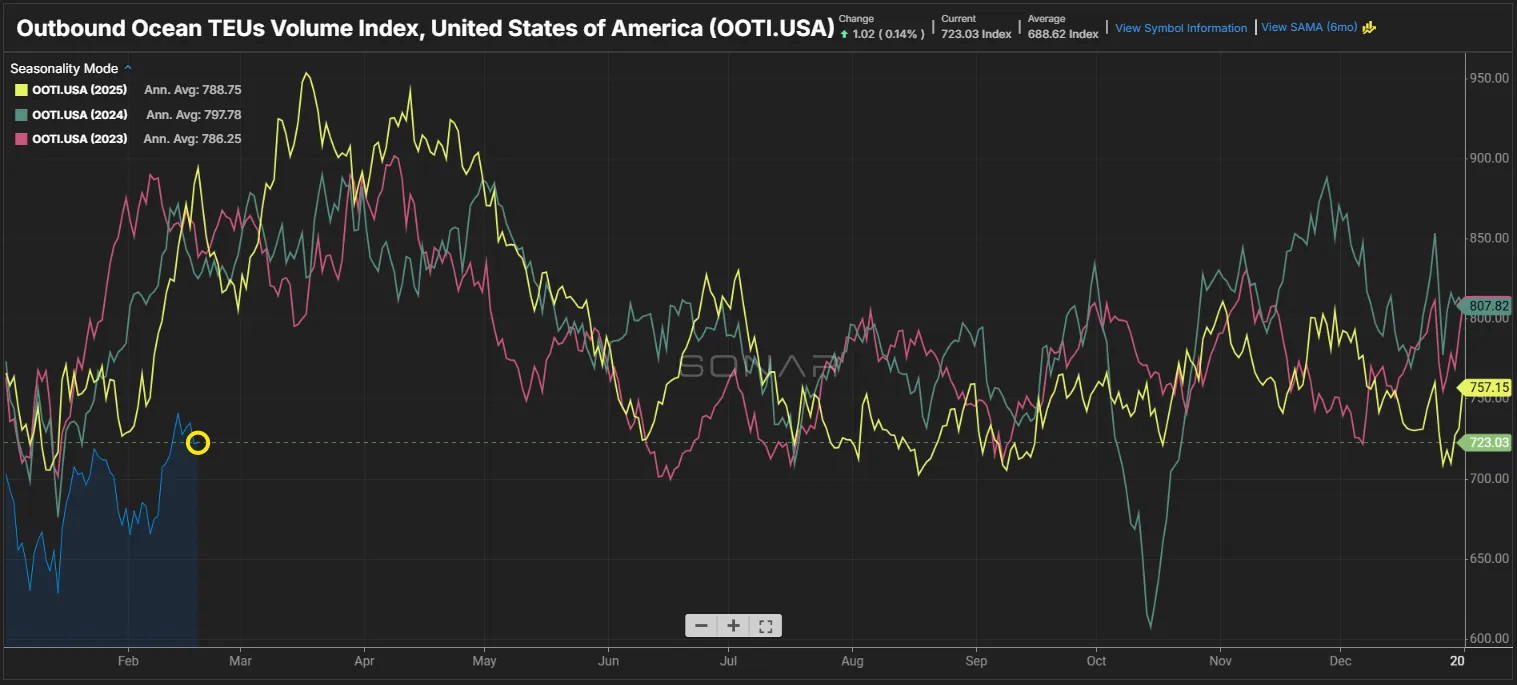
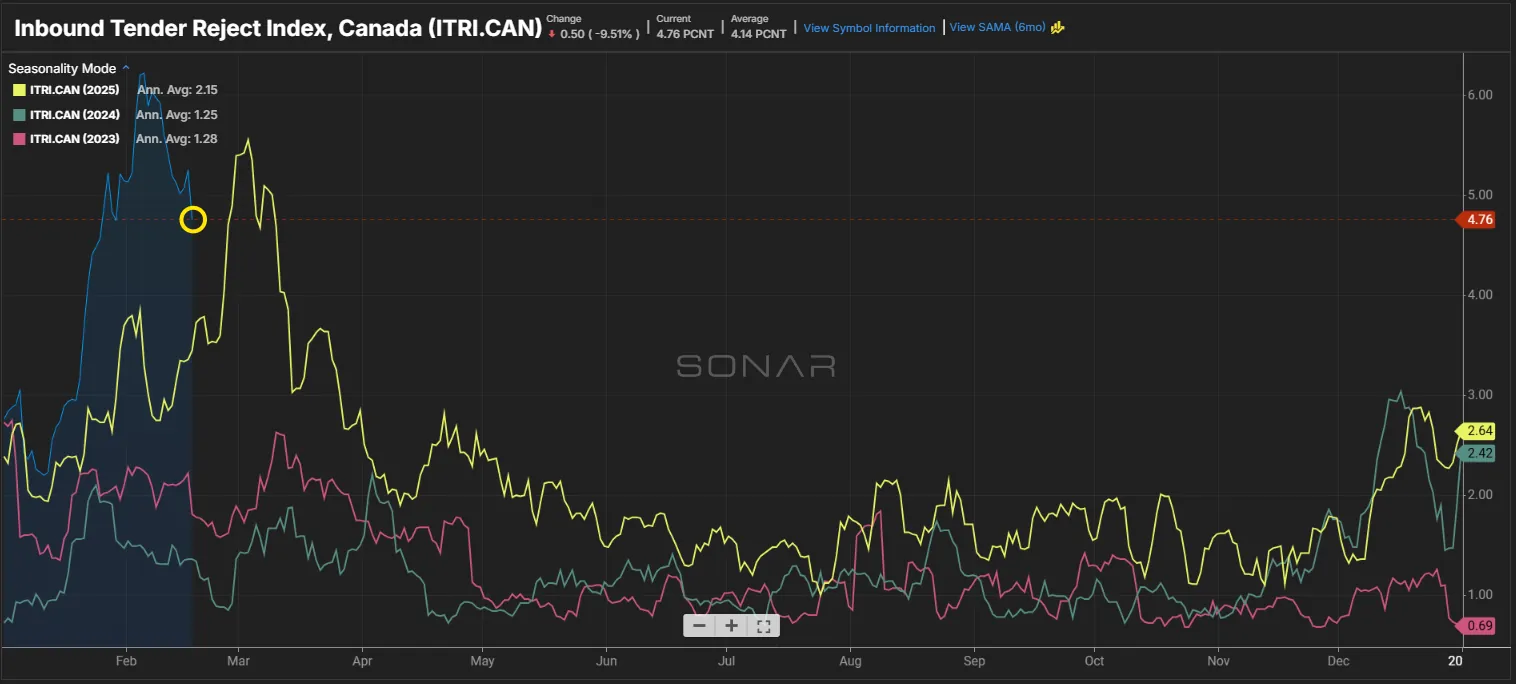
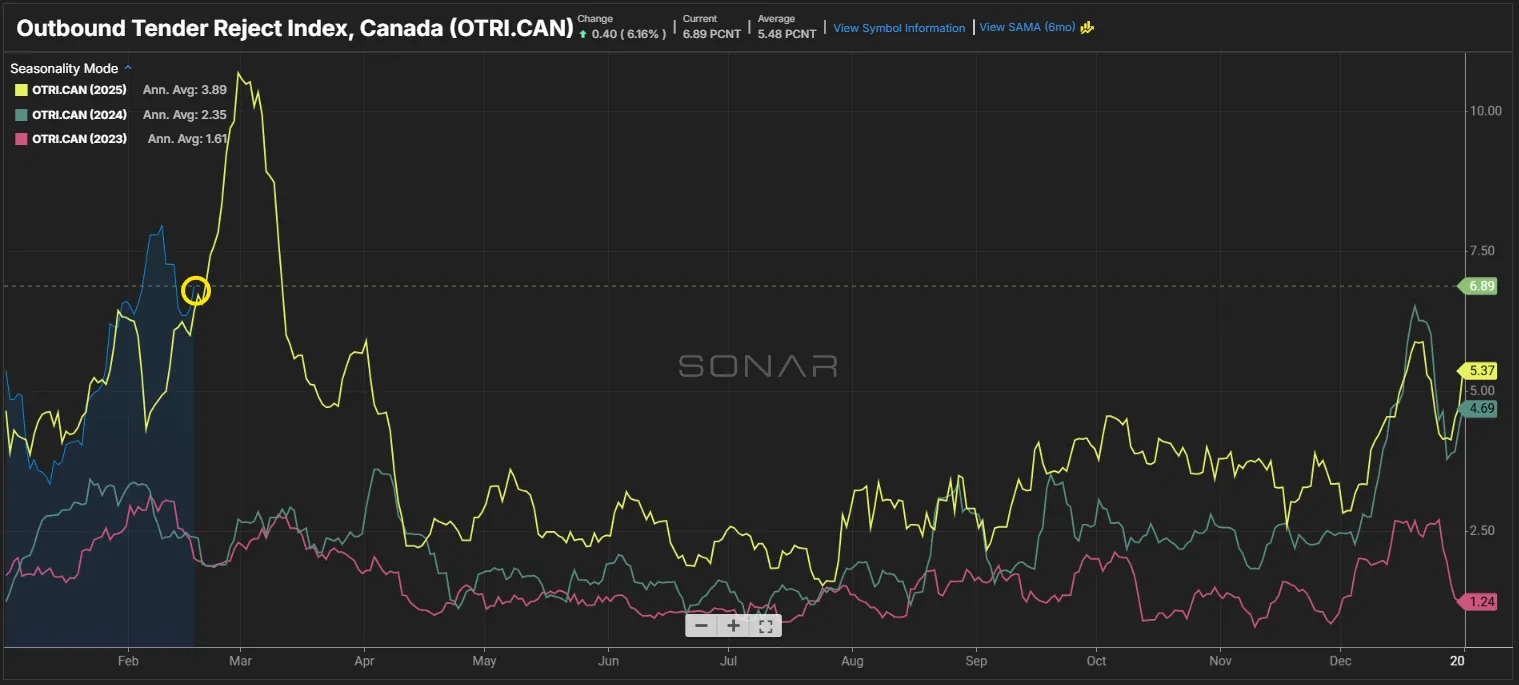


During March, spot rates and contract rates remained inflated vs. last year. We continue to see capacity tightening and higher rejection rates across the U.S.

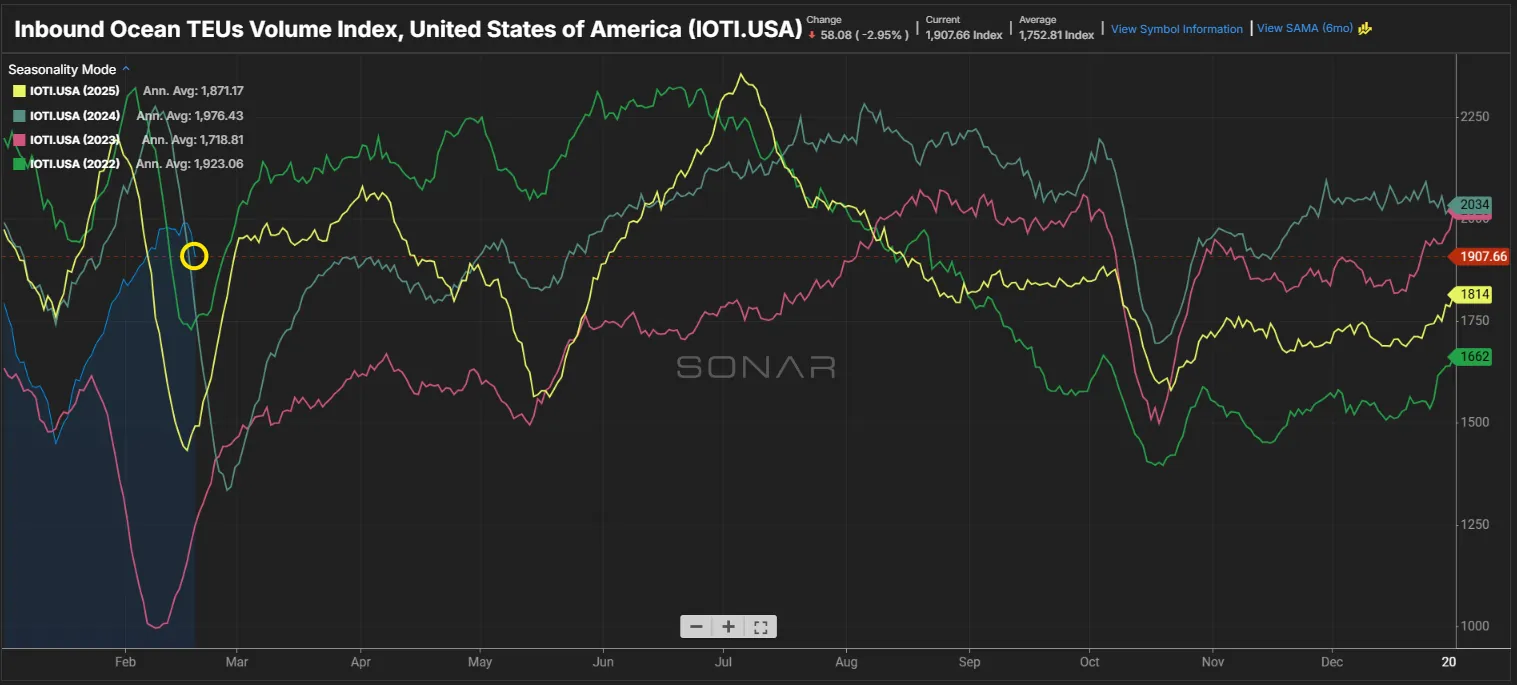
The conversations at this year’s Food Shippers of America Conference highlighted something many in the industry are already sensing…food supply chains are entering a new phase.