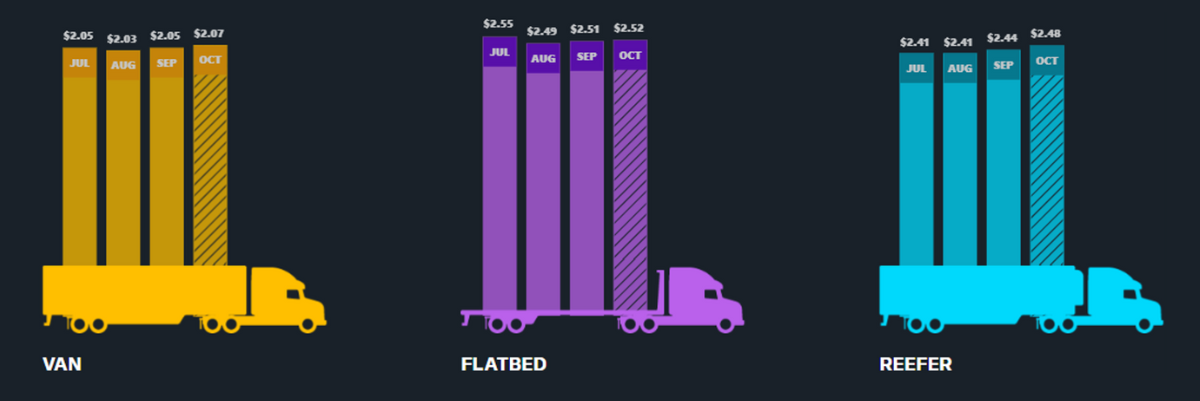
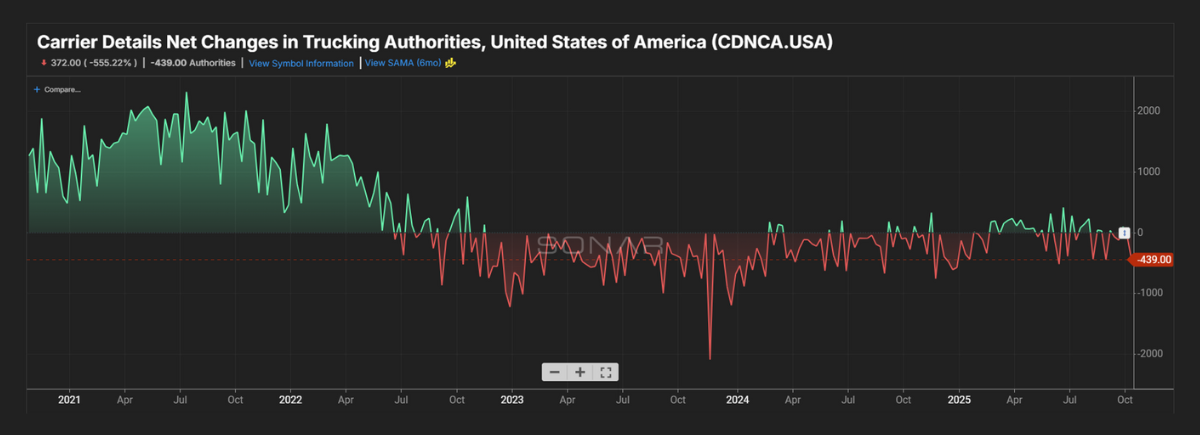
October 2025

Market Update

Transportation Trends

General Outlook

  • Shippers should prepare for potential disruptions and increased rates as we head into the holiday season.
  • Demand will remain stable to slightly down until we get closer to the holiday season.
  • China’s exports to the U.S. fell 27% YoY in September.
  • Retail sales rose 0.6% in August; stronger than expected.
  • Tariff-related delays may impact production, putting pressure on prices.
  • The Middle East tension has pushed some concerns around the oil volatility in the market.
  • Labor market: Private sector lost 32,000 jobs in September; transportation/utilities lost 7,000.
    • Unemployment at 4.3%.
  • 30-year fixed mortgage is at 6.27% in October.

LTL

  • LTL market is seeing positive signs in a relatively soft environment.
  • Tonnage levels remain choppy, but are up 2.1% in 2025.
  • Old Dominion announces a 4.9% General Rate Increase.
  • LTL pricing index remains high despite softness across the U.S.
  • Duie Pyle expands into Mexico – Cross-Border LTL
  • Key Information for LTL shippers when requesting pricing:
    • Dimensions, class, NMFC numbers, and weights are critical to obtain correct pricing on the front end of your shipment.

Truckload

  • Van spot rates decreased (1.0%) vs. this same time last year but remained flat (0.0%) vs. last month.
    • Capacity grew tighter by 87.0% compared to last year and went up 12.4% compared to last month.
    • October Van contracted pricing is up $.35 per mile over the spot market.
  • Reefer spot rates decreased (0.9%) vs. last year and decreased (0.4%) vs. last month.
    • Capacity grew tighter by 118.4% vs. last year and 5.7% vs. last month.
    • October Reefer contracted pricing is tracking up $.84 per mile over the spot market.
  • Flatbed spot rates were down (0.8%) vs. last year and flat (0.0%) vs. last month.
    • Capacity grew tighter by 114.7% vs. last year and by 26.8.1% over last month.
    • October Flatbed contracted pricing is tracking up $0.57 per mile over the spot market.

Reefer rates rise ahead of Thanksgiving

Outbound Tender Volume - All Modes

  • Outbound tender volume dropped through the month of September, but we are starting to see an uptick as we head into Q4 and the holiday season.

Outbound Tender Reject - All Modes

  • Overall Rejects continue to remain higher than 2023 and 2024.
    • Capacity still reflects a tighter market over 2024, but the overall demand of freight is still low. Driver capacity is one of the main causes of rejections we are seeing.

Outbound Tender Reject – by Mode

  • Orange Line – Flatbed: Rejections are down slightly vs. this time last year.
    • Rejections tend to spike as we get closer to winter months and the holiday season.
  • Green line – Reefer: Rejections for Reefer are improving, but slightly higher than this same time last year.
    • Keep a close eye on your carrier capacity as we creep closer to the holiday season.
  • White line – Van: Van Rejections remain flat vs. 2024 but are still not having a large impact on capacity and rates.
    • Rejections continue to fluctuate month- over-month but remain flat since the start of this year.

Carrier Authorities

  • This graph indicates we have less transportation companies coming into the market based on the current demand.
    • Authorities continue to drop which is causing rejections to increase despite the overall volume decrease compared to 2024.

Demand vs. Capacity Metrics - September 2025

Van Load-to-Truck Ratio

Reefer Load-to-Truck Ratio

Flatbed Load-to-Truck Ratio

International

  • S. imports are expected to fall in the double digits in Q4.
  • Carries are looking to re-deploy their equipment to manage the capacity issue.
  • Ocean spot rates trend downward based on weaker demand.
  • Spot rates (China to U.S.) are at their lowest since the Red Sea attacks.
  • S. Container import down 13% in the month of September.

Canadian News

  • Outbound tender rejects increase in October from the levels we saw in September.
  • Inbound tender rejections were up and down in October but overall were down vs. September.
  • Load posting increased 23% in September but overall remained down 13% YoY.

Total Spot Rates

Fuel Forecast - DOE

  • 2024 diesel fuel retail prices averaged $3.761/gallon through Q4 2024 and Q1 2025 finished lower at an average $3.631/gallon, and Q2 finished at $3.555/gallon.
  • Fuel for Q3 finished at $3.757/gallon and Q4 is tracking $3.744/gallon to close out 2025.

Energy Information Administration Diesel Fuel Prices January 1, 2020 - September 31, 2025

Price Index Performance: 2017 -2025, By Quarter, Through September Q3 2025

State of the U.S. Transportation Market

What Does This Data Mean?

The Producer Price Index (PPI) is a family of indexes that measures the average change in selling prices received by domestic producers of goods and services over time. PPIs measure price change from the perspective of the seller. In other words, the PPI measures the trend of the cost of everything manufactured in the United States.

More
articles

Check claim status

To check the status of your claim, or to contact your claim representative, please click the confirmation status link that was sent via email when you filed the claim.

Make an Online Payment 

To make online payments, locate your personalized LockStep payment link sent to you from dlxar@shipdlx.com. If you need help, please contact DLX AR.

Submit an Invoice

Please send your invoice and all backup documents to: