April 2025
Market Update
Transportation Trends
General Outlook
- Inflation continues to trend downward as we head into May.
- The Federal Reserve continues to be patient about any changes to interest rates.
- During March, the unemployment rate was 4.2% and 228,000 jobs were added on non-farm payroll.
- Job gains were seen across health care, social assistance, transportation, and logistics.
- The overall freight market will be on high alert over the next 90 days due to produce shipping season.
- The seasonal demand could put pressure on capacity and rates.
LTL
- First quarter LTL rates remained strong unlike the continued dip we saw on the Truckload side.
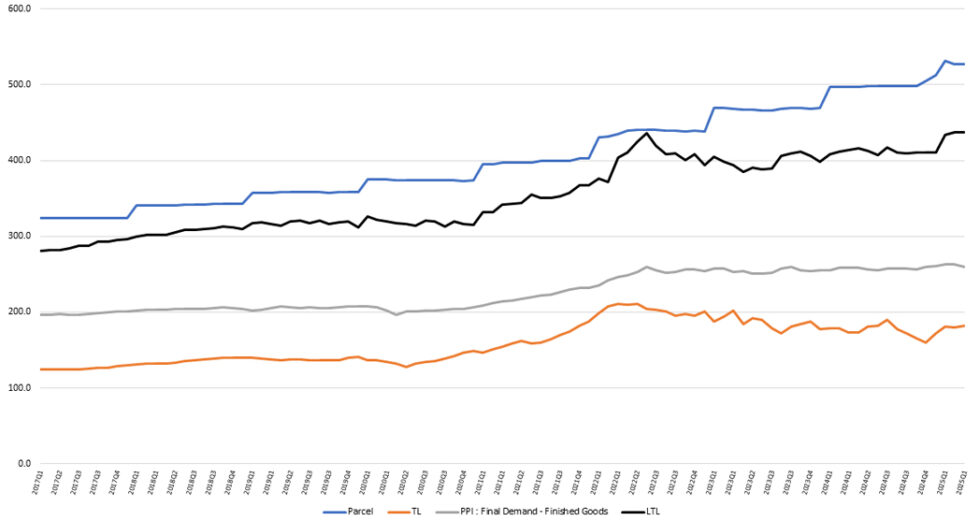
- The LTL Rate-Per-Pound was 63.8% higher in Q1 of 2025 vs. the benchmark of 2018.
- Q2 shows a relatively flat impact from a cost standpoint.
- Saia is moving all its customer services teams from its corporate office to its terminals.
- The National Motor Freight Traffic Association (NMFTA) will be rolling out density-based classifications.
- Shippers will soon have to know the weight and dimensions of all handling units.
- You can prepare for this change by ensuring you have the proper dimensions and weights for all your LTL products.
- Key information for LTL shippers when requesting pricing.
- Dimensions, Class, NMFC numbers, and weights are critical to obtaining correct pricing on the front end of your shipment.
- Shippers will soon have to know the weight and dimensions of all handling units.
- The LTL Rate-Per-Pound was 63.8% higher in Q1 of 2025 vs. the benchmark of 2018.
Truckload
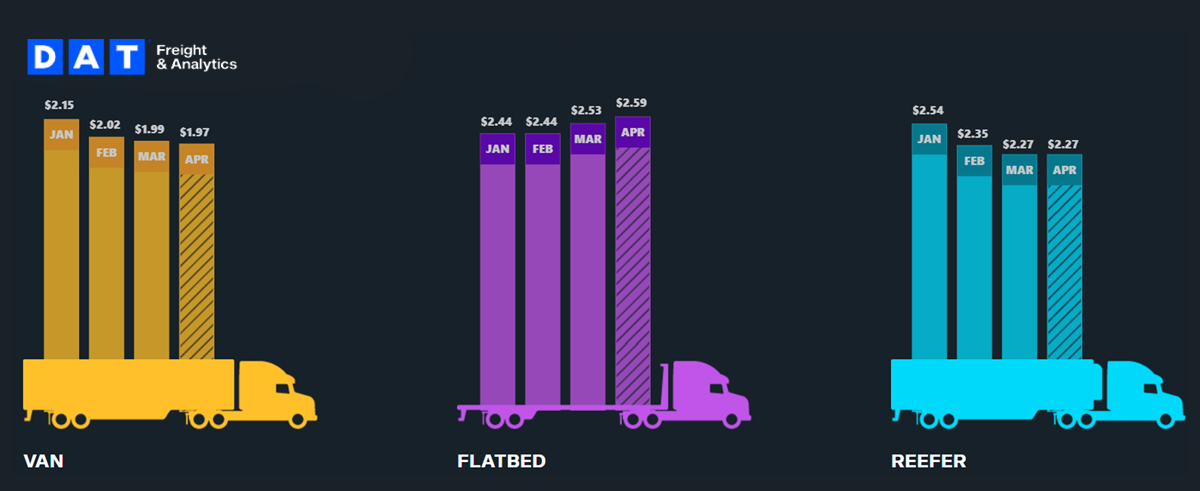
- Van spot rates were up slightly (0.5%) vs. this same time last year and down slightly (1.0%) vs. last month.
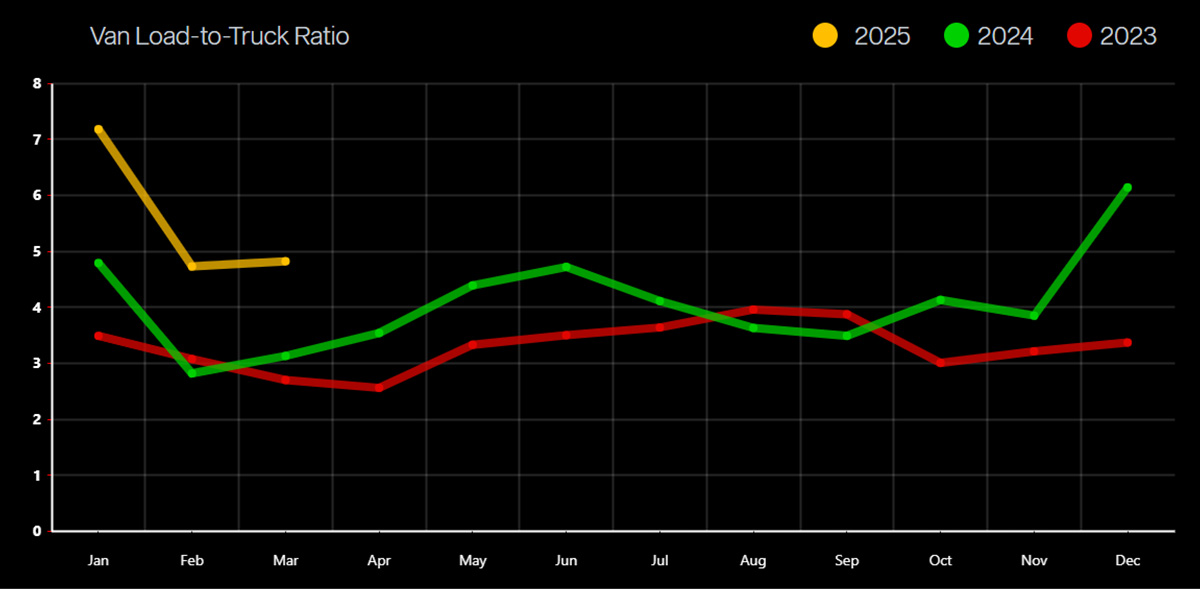
- Capacity grew tighter by 54.1% compared to last year and increased 1.9% compared to last month.
- April Van contracted pricing is up $.43 per mile over the spot market.
- Reefer spot rates decreased (1.7%) vs. last year and (0.9%) vs. last month.
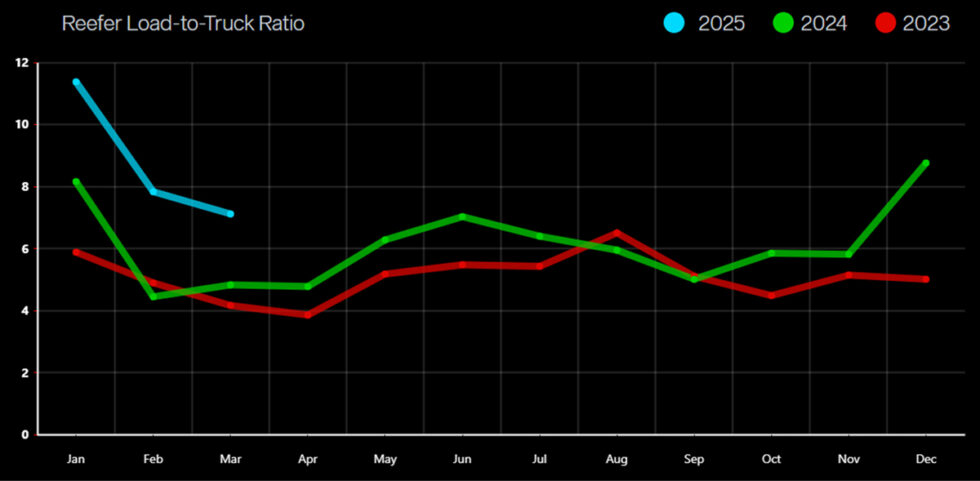
- Capacity grew tighter by 47.3% vs. last year but improved 9.2% vs. last month.
- April Reefer contracted pricing is tracking up $.47 per mile over the spot market.
- Flatbed spot rates are flat (0.0%) vs. last year and flat (0.0%) vs. last month.
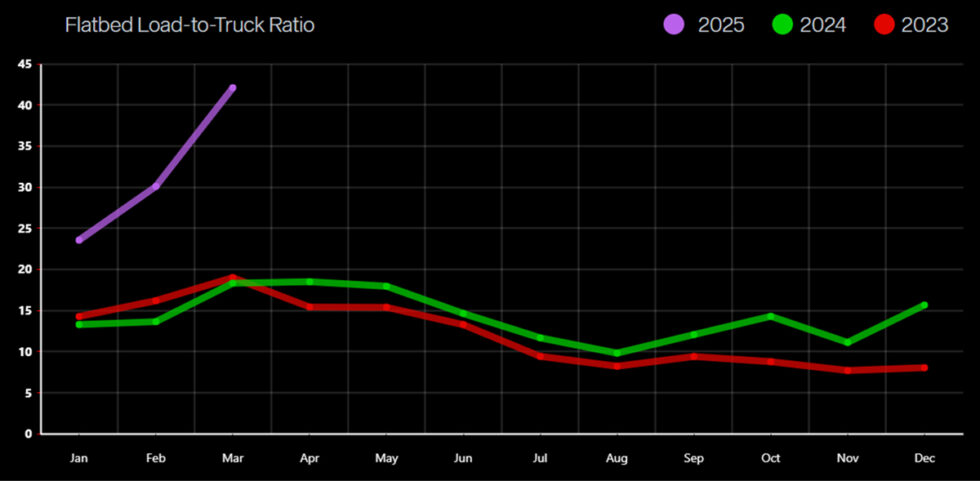
- Capacity decreased by 129.5% vs. last year and by 39.9% over last month.
- April Flatbed contracted pricing is up $0.53 per mile over the spot market.
- Capacity decreased by 129.5% vs. last year and by 39.9% over last month.
Volumes and prices slip further
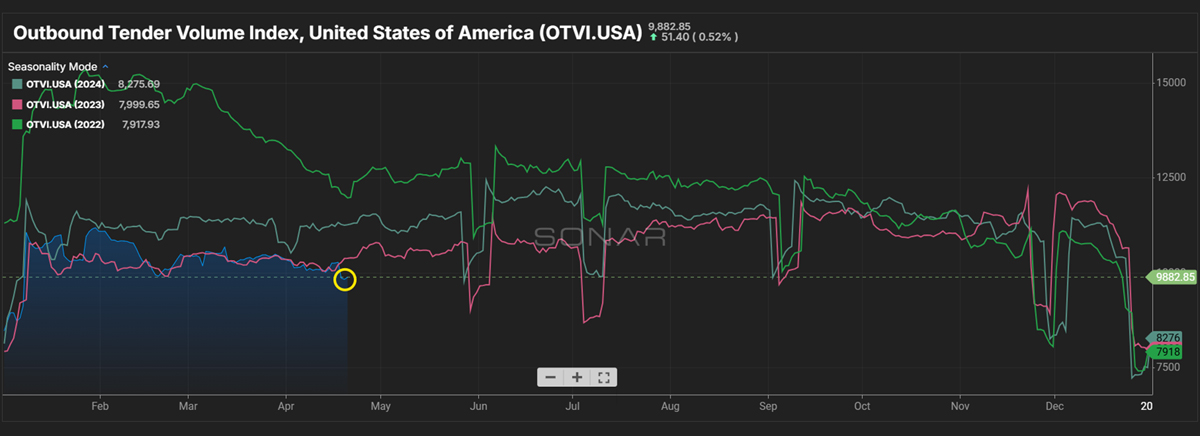
Outbound Tender Volume - All Modes
- Outbound tender volume dropped below both 2023 and 2024 volumes. The lack of volume is still having an impact on pricing in the truckload market.
- Both Spot and Contracted pricing remains low.
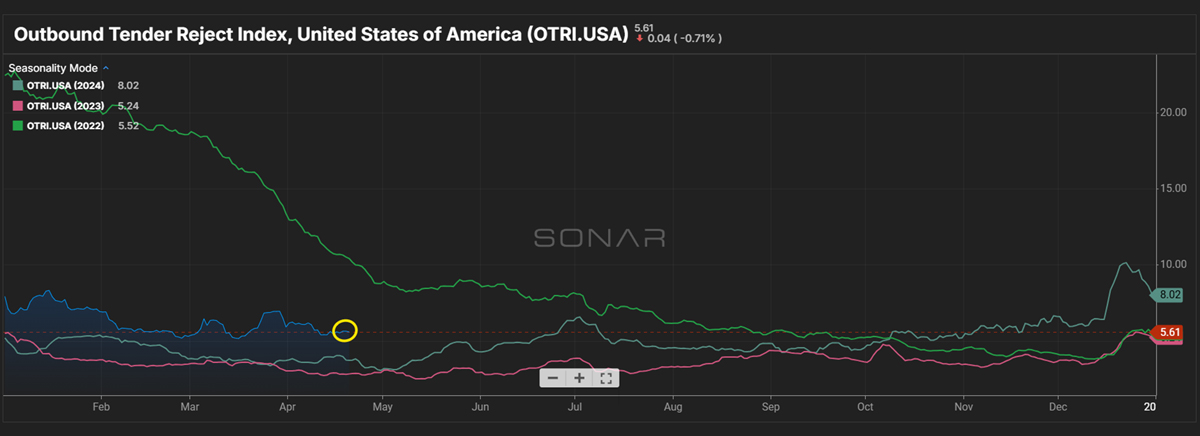
Outbound Tender Reject - All Modes
- Overall Rejects continue to remain higher than 2023 and 2024.
- Capacity is still reflecting a tighter market compared to 2024, but the overall freight demand is still low.
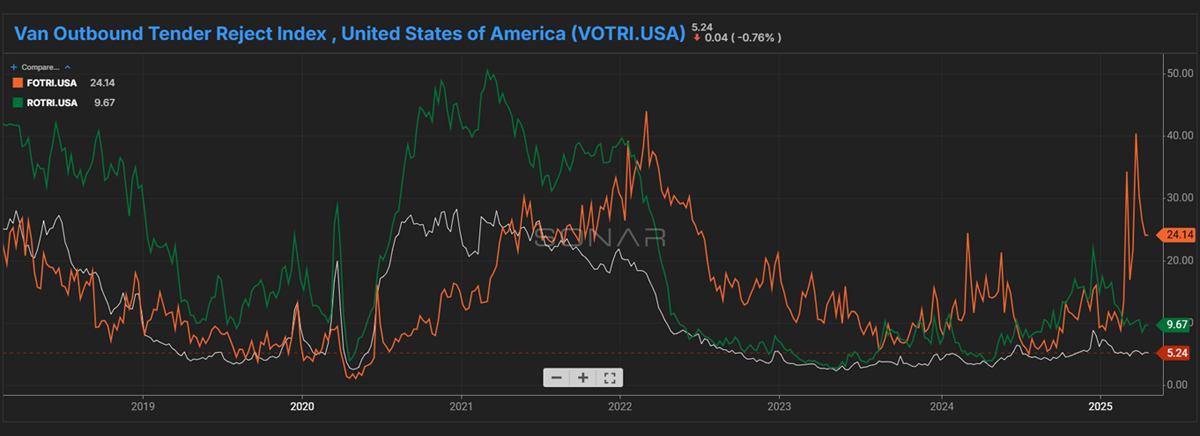
Outbound Tender Reject – by Mode
- Orange Line – Flatbed: Rejections are around the same rate that we experienced in 2024.
- Rejections have continued to drop in the month of April after the spikes in late February and Mid-March.
- Green line – Reefer: Rejections remain slightly higher compared to 2024.
- As we head into produce season, we will keep a close eye on the impact this will have on the rejections within the Reefer equipment.
- White line – Van: Rejections are up slightly compared to 2024 but still are not having a large impact on capacity and rates.
- Rejections have remained steady so far in 2025.
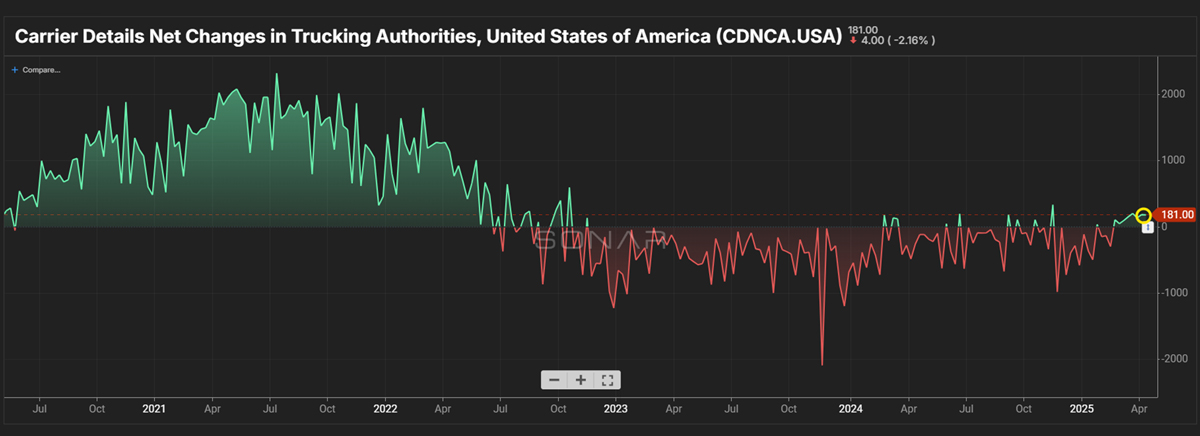
Carrier Authorities
- This graph indicates we have less transportation companies coming into the market based on the current demand.
- This month’s trends show an increase in the number of carrier authorities entering the market vs. what we have seen so far this year.
- As capacity goes, so does the number of carriers in the transportation space.

Van Load-to-Truck Ratio
Reefer Load-to-Truck Ratio
Flatbed Load-to-Truck Ratio
International
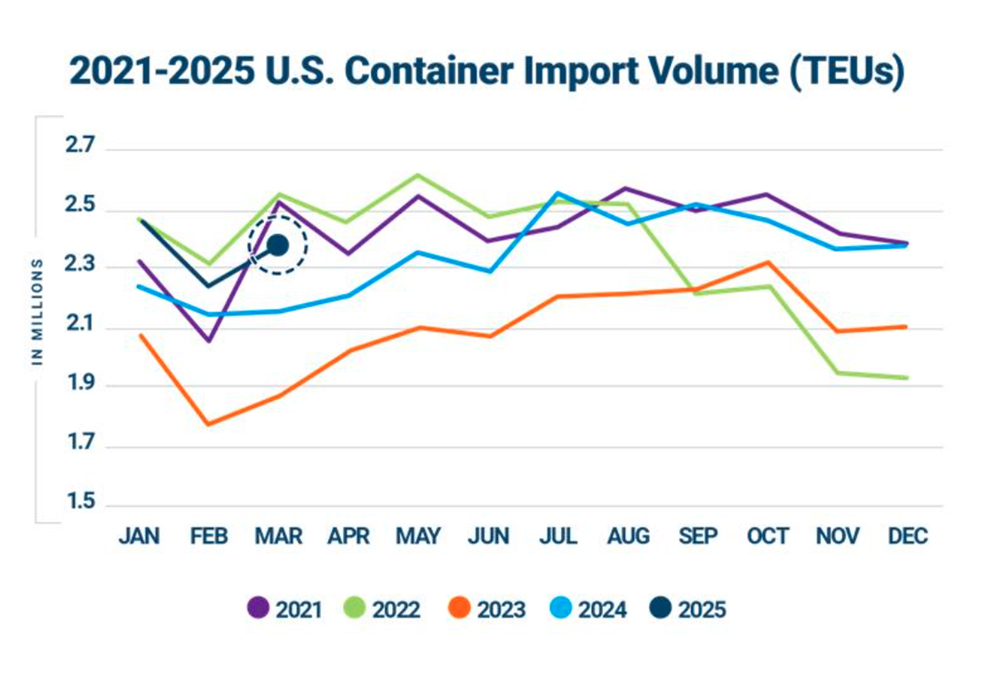
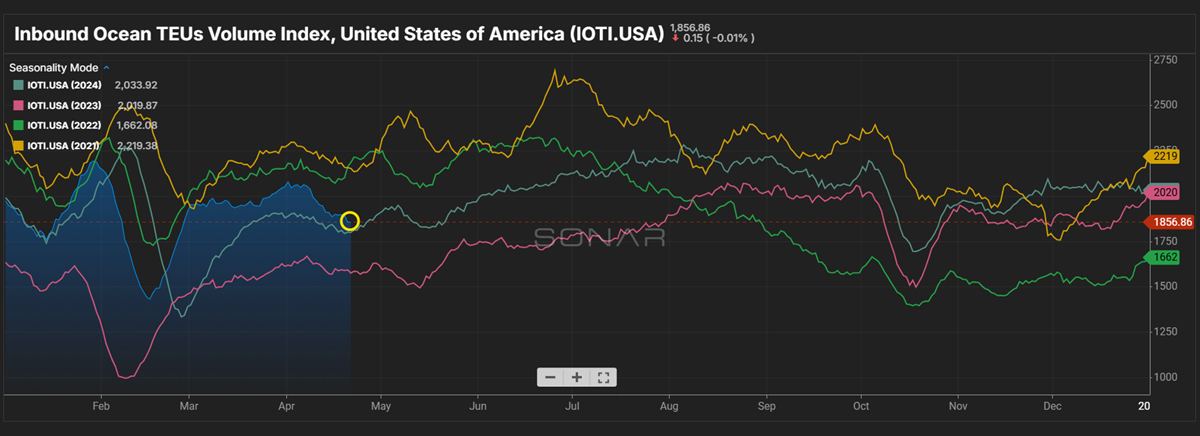
- Inbound TEUs remain up over 2024.
- Volumes dipped in April as the rush for imports hit the US prior to the tariffs going into effect.
- S. container imports were up in March, compared to February.
- Ocean spot rates have dropped due to the increase in capacity.
Canadian News
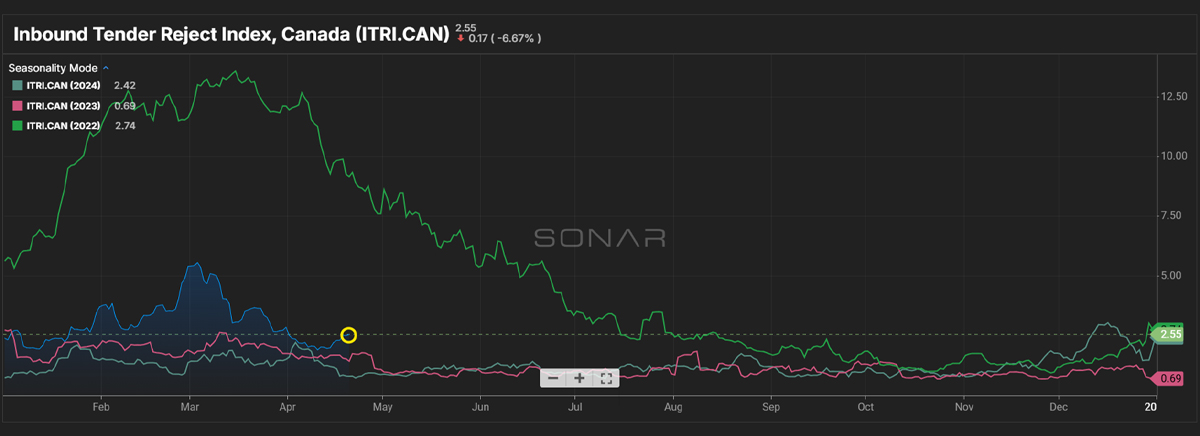
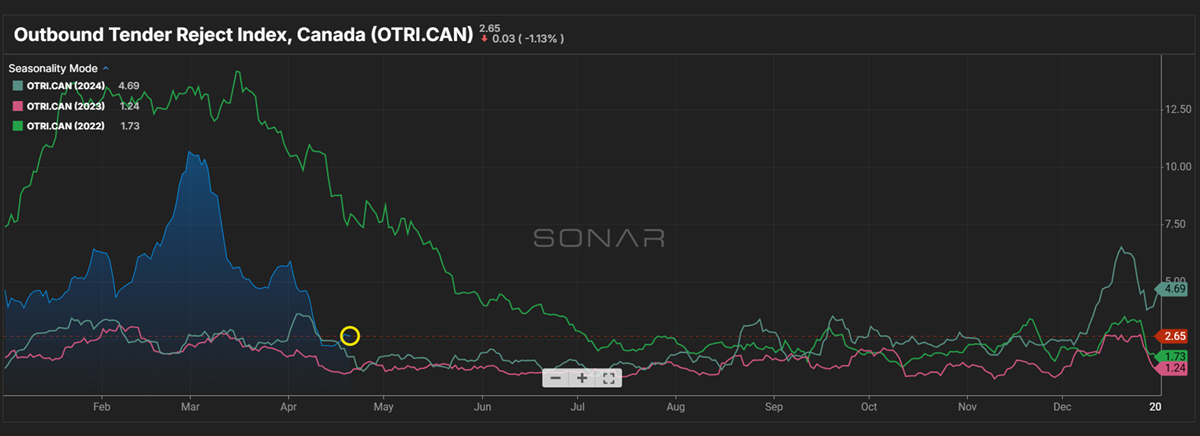
- Inbound and Outbound Rejections continued to drop during the first couple of weeks in April but we have seen a slight uptick as we head into the 2nd half of the month.
- Spot market volume jumped up in March and April vs. what we saw this time last year.
- The pre-Tariff push had an impact on volume, as customers looked to move as much product as they could before the tariffs went into effect.
- Inbound tender rejects remain elevated compared to 2023 and 2024 levels.
- Outbound tenders are also up compared to 2023 and 2024.
Fuel Forecast - DOE
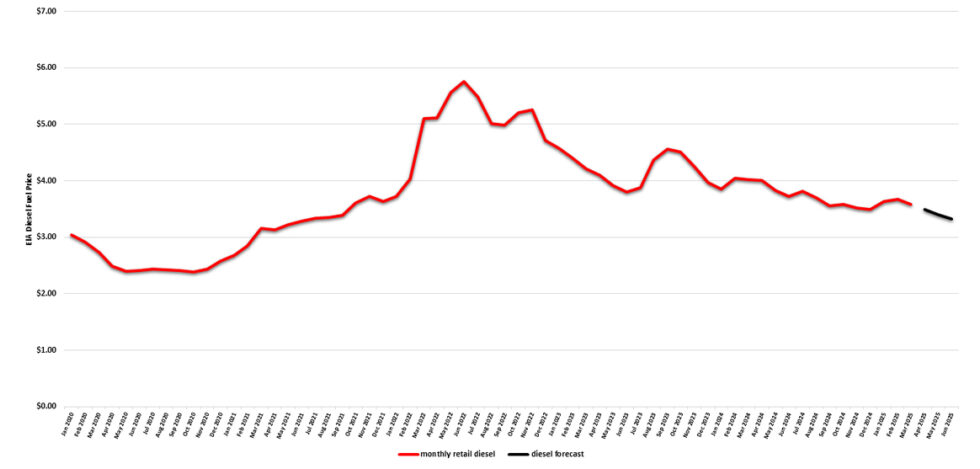
- 2024 diesel fuel retail prices averaged $3.761/gallon through Q4 2024 and Q1 2025 finished lower at an average of $3.631/gallon.
- Fuel for Q2-Q4 of 2025 is forecasted at an average of $3.374/gallon.
Energy Information Administration Diesel Fuel Prices January 1, 2020 - March 31, 2025
Price Index Performance: 2017 -2025, By Quarter, Through March Q1 2025
State of the U.S. Transportation Market
What Does This Data Mean?
The Producer Price Index (PPI) is a family of indexes that measures the average change in selling prices received by domestic producers of goods and services over time. PPIs measure price change from the perspective of the seller. In other words, the PPI measures the trend of the cost of everything Manufactured in the United States.


