July 2024
Market Update
Transportation Trends
General Outlook
- Labor market added 206,000 jobs in June.
- Inventory levels for customers remained low but had a slight increase over last month.
- The Federal Reserve: Inflation tracking to the 2% target, if this continues to keep on the same track, there could be potential cuts in the interest rates in September.
- Mortgage applications fell by 0.2% at the start of July.
- The avg. 30-year fixed-rate mortgage at 7% as of July 5th.
LTL
- FedEx potentially looking to sell off its LTL offering similar to what UPS did a few years back.
- This would have an impact on those who have bundled pricing with their LTL and Parcel shipping.
- Saia opens 2 new terminals, one in California and the other in Iowa.
- Saia is also looking at additional expansions in 2024, there is a potential add of 18 to 21 new sites.
- In August the National Motor Freight Traffic Association (NMFTA) will be rolling out density-based classification for 3PLs.
- Key Information for LTL shippers when requesting pricing.
- Dimensions, Class, NMFC numbers, & weights are critical to getting the correct price on the front end of your shipment.
Truckload
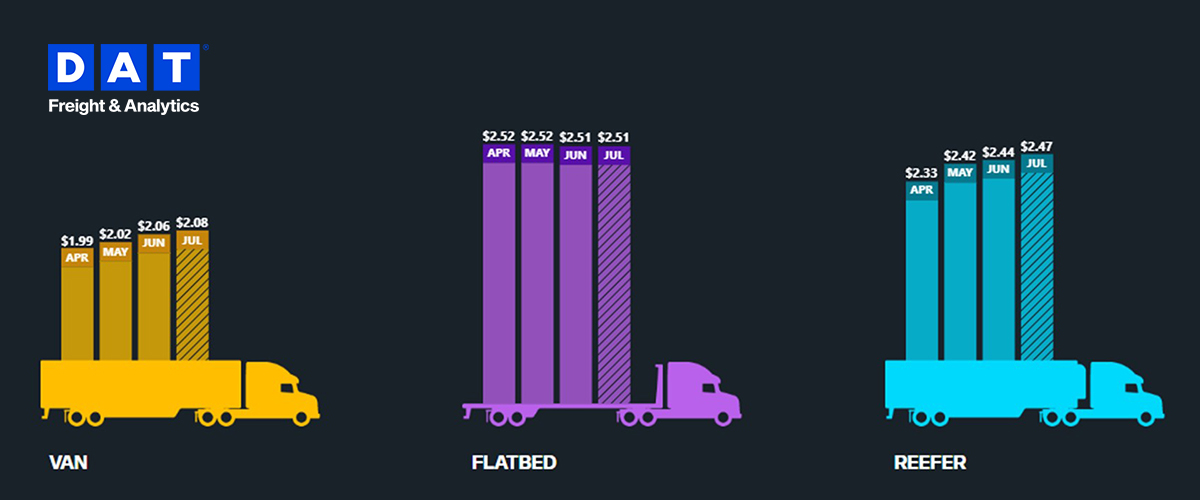
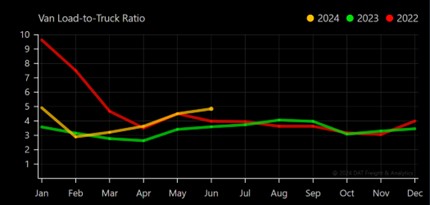
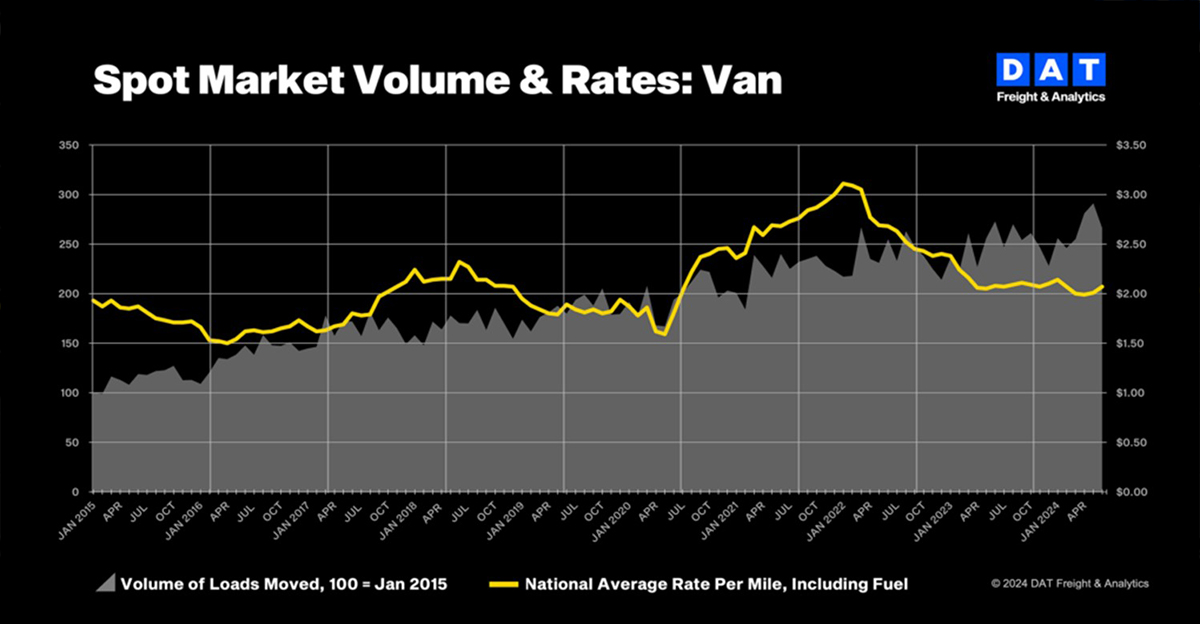
- Van spot rates were down 1.1% vs. this same time last year but up 1.7% vs. last month. Capacity tightened from last year same time by 34.9% and 7.5% vs. last Month. July Van contracted pricing is up $.37 per mile over spot market.
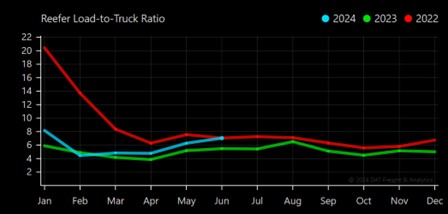
- Reefer spot rates went down 1.9% vs. this same time last year, but up 0.8% vs. last month. Capacity tightened from last year this same time by 28.2% and 11.9% vs. last month. July Reefer contracted pricing is tracking up $.32 per mile over spot market.
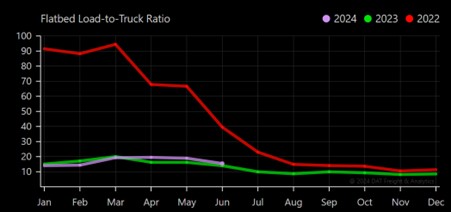
- Flatbed spot rates are down 4.2% vs. this same time last year, and down 0.6% vs. last month. Capacity decreased 9.7% vs. this same time last year but improved 18.5% over last month. July Flatbed contracted pricing is tracking up $0.62 per mile over spot market.
Outbound Tender Volume - All Modes
Demand still showing up vs last year. July 4th impact on outbound tender volume still stayed consistent with years past. Overall volume still continues to trend over last year this same time frame.

Outbound Tender Reject - All Modes
Overall Rejects still up over 2023 during this same time, but overall still what we saw in 21’ & 22’.

Outbound Tender Reject – by Mode
- Orange Line – Flatbed – Rejections have gone up and down in July. Currently at the lowest rejection point so far this year.
- Green line – Reefer – Rejections have climbed over the last 2 months, which isn’t surprising based on the summer conditions. Overall, the market remains stable with available capacity vs. previous years.
- Blue – Van – Van Rejections picked up a little in July vs. what we saw in May/June, but overall it still remains down over the other 2 modes.

Carrier Authorities
- This graph indicates we have less transportation companies coming into the market based on the current demand.
- Carrier Authorities continue to drop into the summer months, which could have a negative impact if the overall outbound volume continues to climb into Q4 or Q1 of 2025.


Van Load-to-Truck Ratio
Reefer Load-to-Truck Ratio
Flatbed Load-to-Truck Ratio
International
- Container import volume increased 14% year over year in June and is tracking up 18% in July.
- Spot rates on the ocean side have continue to go up from China to the US.
- Weather and container capacity have been the biggest impact to the pricing.

Canadian News
- Spot market continues to improve.
- Rates down across all equipment types
- Van down by $.06 per mile
- Reefer down by $.04 per mile
- Flatbed down by $.01 per mile
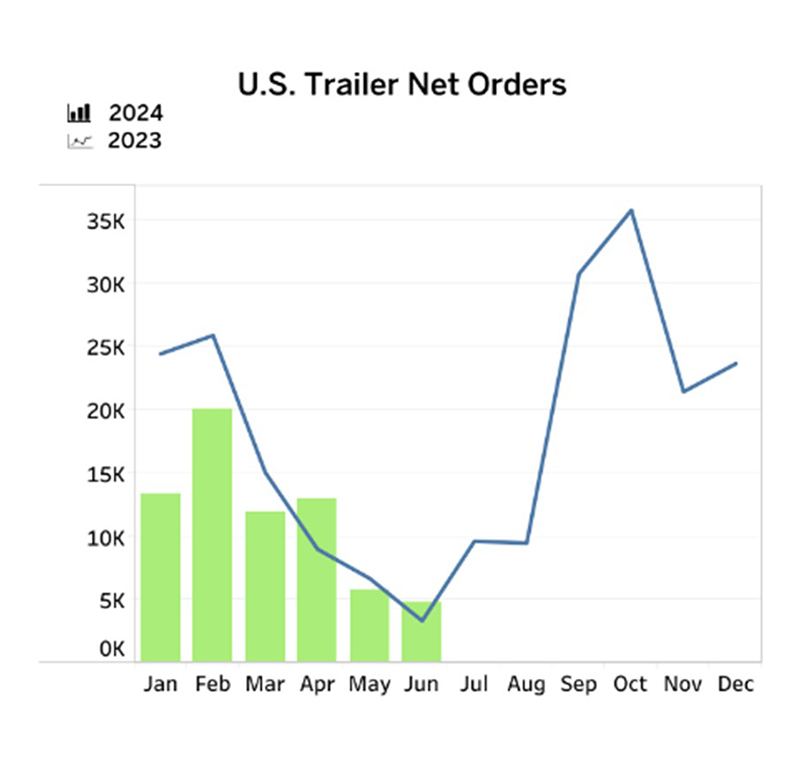
- Trailer orders continue to go down.
- June numbers down 17% from May, and 71% off the monthly average over the last 12 months.
- Rates down across all equipment types
Fuel Forecast - DOE
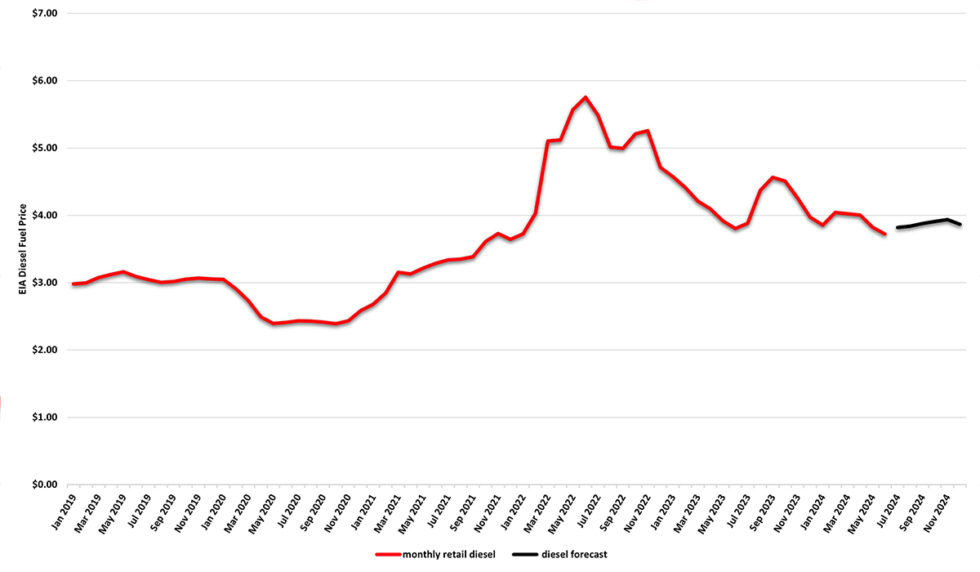
Average diesel fuel retail prices for 2023 averaged at $4.214/gallon through Q4 2023 and Q1 2024 fuel finished at an averaged $3.973/gallon. Fuel for Q2 finished at $3.849/gallon, and Q3 & Q4 are forecasted to come in around $3.874/gallon.
Energy Information Administration Diesel Fuel Prices January 1, 2019 - June 30, 2024
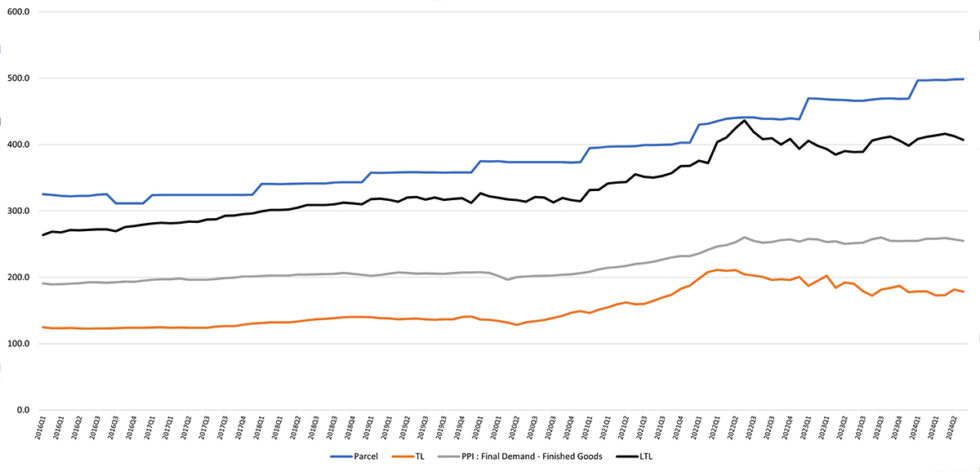
Price Index Performance: 2016 -2023, By Quarter, Through June Q2 2024
State of the U.S. Transportation Market
What Does This Data Mean?
The Producer Price Index (PPI) is a family of indexes that measures the average change in selling prices received by domestic producers of goods and services over time. PPIs measure price change from the perspective of the seller. In other words, the PPI measures the trend of the cost of everything Manufactured in the United States.


